HOT TOPICS LIST
- MACD
- Fibonacci
- RSI
- Gann
- ADXR
- Stochastics
- Volume
- Triangles
- Futures
- Cycles
- Volatility
- ZIGZAG
- MESA
- Retracement
- Aroon
INDICATORS LIST
LIST OF TOPICS
PRINT THIS ARTICLE
by Gary Grosschadl
Most traders now avail themselves to the benefits of Japanese candlestick charting to shine on the path of enlightenment. What worked for rice traders centuries ago still works today in all areas of trading. Bar and point & figure charting still work, but I prefer the visual enhancements that candlesticks provide. Traders often see themselves in battle with the markets and candlesticks lend themselves quite well to the ongoing battle between bulls and bears.
Position: N/A
Gary Grosschadl
Independent Canadian equities trader and technical analyst based in Peterborough
Ontario, Canada.
PRINT THIS ARTICLE
CANDLESTICK CHARTING
Nasdaq and the Dangerous Doji
04/01/02 11:25:56 AMby Gary Grosschadl
Most traders now avail themselves to the benefits of Japanese candlestick charting to shine on the path of enlightenment. What worked for rice traders centuries ago still works today in all areas of trading. Bar and point & figure charting still work, but I prefer the visual enhancements that candlesticks provide. Traders often see themselves in battle with the markets and candlesticks lend themselves quite well to the ongoing battle between bulls and bears.
Position: N/A
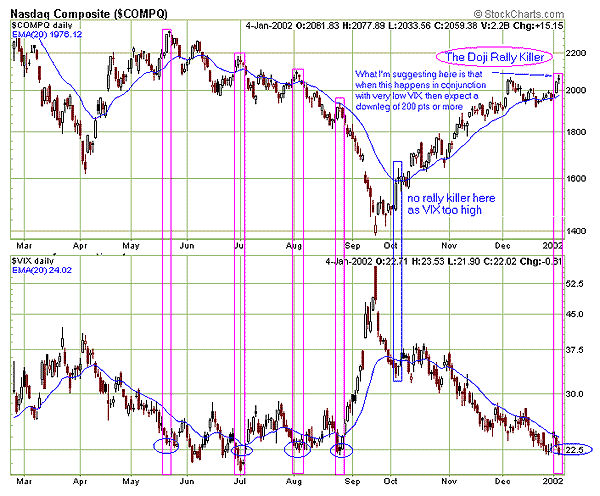
| One of my favorite patterns are doji reversals at tops and bottoms. I take a close look at any doji or near doji candlestick at these turning points. Dojis have the same opening and closing price, reflecting indecision in the market place. They appear as "crosses" on the chart. When a stock or index soars to new heights, momentum carries it on. Nervous traders looking to exit watch this momentum carefully and often the first sign of loss of this upward drive is a balance between the bulls and bears (buyers and sellers). This can be interpreted as indicision. |
| Without getting into the specific doji patterns, suffice to say any doji after an extended rise is a "dangerous doji" and often marks the beginning of a swift and deadly reversal in all time frames. |

|
| The Dangerous Doji Rally Killer |
| Graphic provided by: stockcharts.com. |
| |
| Following the theme of my previous articles on the inverse relationship of the Nasdaq/VIX, let's add the "dangerous doji" concept. On the chart above, I've marked the significant dojis. Those appearing at market extremes are particularily dangerous. Again I am using the VIX to mark levels of extreme bearishness or bullishness. For my money, VIX readings of 23.5 or below mark extreme bearish potential while readings of 37.5 and above mark extreme bullish potential. These levels can be considered potential market turning points in the making and should be closely monitored for subsequent evidence of a likely extended move. In this case I am using the doji to time turning points when VIX levels are on the overextended or overbought side. |
| This chart from January 4, 2002 marks a critical point - another dangerous doji. This was a significant warning to candlestick charters that all was not well. The outcome of this last doji was a deadly drop from Nasdaq 2100 to ultimately 1700 - a 400 point drop. Need I say more? Beware the "dangerous doji." |
Independent Canadian equities trader and technical analyst based in Peterborough
Ontario, Canada.
| Website: | www.whatsonsale.ca/financial.html |
| E-mail address: | gwg7@sympatico.ca |
Click here for more information about our publications!
Comments
Date: 04/01/02Rank: 2Comment:
Date: 04/02/02Rank: 4Comment:
Date: 04/02/02Rank: 4Comment:
Date: 04/02/02Rank: 4Comment:
Date: 04/03/02Rank: 5Comment:
Date: 04/29/08Rank: 5Comment:

Request Information From Our Sponsors
- StockCharts.com, Inc.
- Candle Patterns
- Candlestick Charting Explained
- Intermarket Technical Analysis
- John Murphy on Chart Analysis
- John Murphy's Chart Pattern Recognition
- John Murphy's Market Message
- MurphyExplainsMarketAnalysis-Intermarket Analysis
- MurphyExplainsMarketAnalysis-Visual Analysis
- StockCharts.com
- Technical Analysis of the Financial Markets
- The Visual Investor
- VectorVest, Inc.
- Executive Premier Workshop
- One-Day Options Course
- OptionsPro
- Retirement Income Workshop
- Sure-Fire Trading Systems (VectorVest, Inc.)
- Trading as a Business Workshop
- VectorVest 7 EOD
- VectorVest 7 RealTime/IntraDay
- VectorVest AutoTester
- VectorVest Educational Services
- VectorVest OnLine
- VectorVest Options Analyzer
- VectorVest ProGraphics v6.0
- VectorVest ProTrader 7
- VectorVest RealTime Derby Tool
- VectorVest Simulator
- VectorVest Variator
- VectorVest Watchdog
