HOT TOPICS LIST
- MACD
- Fibonacci
- RSI
- Gann
- ADXR
- Stochastics
- Volume
- Triangles
- Futures
- Cycles
- Volatility
- ZIGZAG
- MESA
- Retracement
- Aroon
INDICATORS LIST
LIST OF TOPICS
PRINT THIS ARTICLE
by Donald W. Pendergast, Jr.
When two time-tested trading systems agree on a sell signal, it may be time to pay attention.
Position: Sell
Donald W. Pendergast, Jr.
Donald W. Pendergast is a financial markets consultant who offers specialized services to stock brokers and high net worth individuals who seek a better bottom line for their portfolios.
PRINT THIS ARTICLE
TRADING SYSTEMS
WFR New RMO And ParaSar Sell Signals
06/02/11 08:26:05 AMby Donald W. Pendergast, Jr.
When two time-tested trading systems agree on a sell signal, it may be time to pay attention.
Position: Sell
| While it may be too early to determine if Wednesday's wide-range reversal bar in the .SPX was the harbinger of a major selloff to come, it's always a good idea to focus on high-profile sell signals in weak relative strength large-cap stocks any time the broad market starts to tumble. |

|
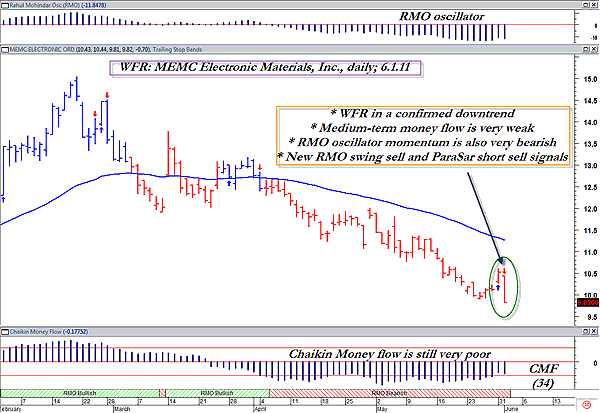
| FIGURE 1: WFR, DAILY. No stock is so beaten down that it can't still go lower; all probabilities would seem to favor even lower prices for WFR in the coming weeks. |
| Graphic provided by: MetaStock. |
| Graphic provided by: Rahul Mohindar RMO indicators from Metastock v.11. |
| |
| MEMC Electronic Materials (WFR) has been in a slump for the past 14 weeks since peaking on February 18, 2011, and is down more than 50% in that short amount of time. However, the stock is now giving even more evidence that the selling may be continuing for some time now that both the Rahul Mohindar (RMO) and ParaSar trading systems are in agreement that going short is the right side of the market to be with this stock. Looking at the daily graph of WFR (Figure 1), we find little to refute the logic of each system's decision to go short; money flow, as measured by the 34-period Chaikin money flow histogram (CMF)(34), is heavily mired in the sub-zero line zone and the RMO oscillator (top of chart) is also heavily biased to the bearish side of the market equation. The stock is also in a confirmed daily downtrend (a series of lower swing highs and lower swing lows still in effect) and it has one of the worst 13-week comparative relative strength rankings versus the .SPX. |

|
| FIGURE 2: WFR BID-ASK. Bid-ask spreads in the July 2011 $10 WFR put are extremely tight -- just what a short-term option player needs to help put the odds more in their favor. |
| Graphic provided by: Thinkorswim. |
| |
| Playing the WFR short setup here might be as simple as selling into the market on a sell-stop break below $9.82 and then protecting the position with a two- to three-bar trailing stop of the stock's daily highs. Option traders more interested in catching a quick and short drop down might instead take a look at the July 2011 WFR $10 long put option play (Figure 2) and the put is selling for about $0.65 as of Wednesday's close and stands to make a reasonably good profit on a sudden surge down toward the $9 zone, provided you don't overstay your welcome and get too greedy -- especially in a short play that might see a sudden short covering rally in the next few weeks. |
| Overall, this looks like a good short play in WFR, so do some more research on your own and see if this is a good fit with your own trading temperament and account risk guidelines. |
Donald W. Pendergast is a financial markets consultant who offers specialized services to stock brokers and high net worth individuals who seek a better bottom line for their portfolios.
| Title: | Writer, market consultant |
| Company: | Linear Trading Systems LLC |
| Jacksonville, FL 32217 | |
| Phone # for sales: | 904-239-9564 |
| E-mail address: | lineartradingsys@gmail.com |
Traders' Resource Links | |
| Linear Trading Systems LLC has not added any product or service information to TRADERS' RESOURCE. | |
Click here for more information about our publications!
PRINT THIS ARTICLE

Request Information From Our Sponsors
- StockCharts.com, Inc.
- Candle Patterns
- Candlestick Charting Explained
- Intermarket Technical Analysis
- John Murphy on Chart Analysis
- John Murphy's Chart Pattern Recognition
- John Murphy's Market Message
- MurphyExplainsMarketAnalysis-Intermarket Analysis
- MurphyExplainsMarketAnalysis-Visual Analysis
- StockCharts.com
- Technical Analysis of the Financial Markets
- The Visual Investor
- VectorVest, Inc.
- Executive Premier Workshop
- One-Day Options Course
- OptionsPro
- Retirement Income Workshop
- Sure-Fire Trading Systems (VectorVest, Inc.)
- Trading as a Business Workshop
- VectorVest 7 EOD
- VectorVest 7 RealTime/IntraDay
- VectorVest AutoTester
- VectorVest Educational Services
- VectorVest OnLine
- VectorVest Options Analyzer
- VectorVest ProGraphics v6.0
- VectorVest ProTrader 7
- VectorVest RealTime Derby Tool
- VectorVest Simulator
- VectorVest Variator
- VectorVest Watchdog
