HOT TOPICS LIST
- MACD
- Fibonacci
- RSI
- Gann
- ADXR
- Stochastics
- Volume
- Triangles
- Futures
- Cycles
- Volatility
- ZIGZAG
- MESA
- Retracement
- Aroon
INDICATORS LIST
LIST OF TOPICS
PRINT THIS ARTICLE
by Koos van der Merwe
Many technicians talk of recurring patterns in charts. Chart pattern recognition is said to simplify technical analysis. So are patterns worth following?
Position: N/A
Koos van der Merwe
Has been a technical analyst since 1969, and has worked as a futures and options trader with First Financial Futures in Johannesburg, South Africa.
PRINT THIS ARTICLE
Are Patterns Worth Following?
06/02/11 08:29:22 AMby Koos van der Merwe
Many technicians talk of recurring patterns in charts. Chart pattern recognition is said to simplify technical analysis. So are patterns worth following?
Position: N/A
| Patterns are an integral part of technical analysis, and many charting programs offer a pattern add-on to assist in the analysis of a chart. I have often wondered whether they are restricted to a historical time span -- for example, chart patterns of the 1970s when there were no computers, and stock trading was accomplished by phoning the floor and talking to a broker, so trading took minutes, and not fractions of a second, as they do today. Nevertheless, with many experts talking about another correction in the pipeline, I decided to look for a pattern that could give us a hint of what to expect. Here is the result of my research. I wrote about this in my April 2011 article in STOCKS & COMMODITIES, "Today's K-Wave." |

|
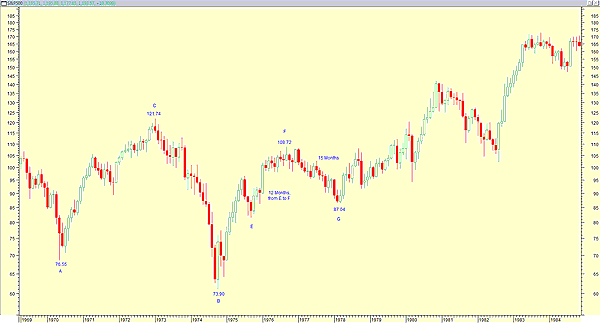
| FIGURE 1: S&P 500 1972, MONTHLY |
| Graphic provided by: MetaStock. |
| |
| Figure 1 shows the Standard & Poor's 500 monthly index from 1969 to 1984. Note how the price bottomed at 76.55 (point A), rose to 121.74 (C), then fell to a new low of 73.90 (B). From that point it rose in the start of a new bull market to D with a small correction (E) before continuing on the 108.72 at F. This took 12 months to complete. From this level, it dropped 19.94% to 87.04 at G before continuing with its new major bull rise, as you can see on the chart. The time taken from F to G, from October 1976 to February 1978, is 15 months. |

|
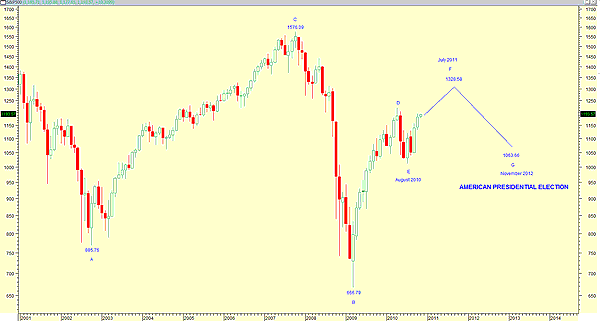
| FIGURE 2: S&P 500 TODAY, MONTHLY |
| Graphic provided by: MetaStock. |
| |
| Figure 2 shows a similar pattern in the making, but from 2003 to today. Note how the chart rose from 885.76 (point A) to 1576.09 (C). The price then dropped to 666.79 (B) (a significant devilish number in itself) rising to the D and E correction in a pattern similar to Figure 1. Should the chart now continue to follow the pattern, we should see a 12-month rise from E, which should take us to end of July 2011. Should the pattern continue, there should be a 15-month correction from F to G of 19.94% approximately, which would be to November 2012. Of course, the question is, how high can F go? Should the chart follow the pattern, we can see in Figure 1 that the price fell from 121.74 to 73.90, and then rose to 108.72, a 72.78% retracement. Applying this percentage to the chart, Figure 2, a 72.78% rise from 666.79, should see the S&P rise to 1328.58. From that level it should drop 19.94% , to 1063.66, a 10.89% from present levels. Will the pattern of 1972 show itself today? With all the pundits out there calling for a double dip, although some of them are saying that the correction will not be as drastic as they first thought it to be, the pattern of 1972 looks very real. Always keep in mind that November 2012 is also the US Presidential election. Will President Obama be reelected? So now we should look at the US Presidential cycle. Whew...a tough year ahead of us. |
Has been a technical analyst since 1969, and has worked as a futures and options trader with First Financial Futures in Johannesburg, South Africa.
| Address: | 3256 West 24th Ave |
| Vancouver, BC | |
| Phone # for sales: | 6042634214 |
| E-mail address: | petroosp@gmail.com |
Click here for more information about our publications!
PRINT THIS ARTICLE

Request Information From Our Sponsors
- StockCharts.com, Inc.
- Candle Patterns
- Candlestick Charting Explained
- Intermarket Technical Analysis
- John Murphy on Chart Analysis
- John Murphy's Chart Pattern Recognition
- John Murphy's Market Message
- MurphyExplainsMarketAnalysis-Intermarket Analysis
- MurphyExplainsMarketAnalysis-Visual Analysis
- StockCharts.com
- Technical Analysis of the Financial Markets
- The Visual Investor
- VectorVest, Inc.
- Executive Premier Workshop
- One-Day Options Course
- OptionsPro
- Retirement Income Workshop
- Sure-Fire Trading Systems (VectorVest, Inc.)
- Trading as a Business Workshop
- VectorVest 7 EOD
- VectorVest 7 RealTime/IntraDay
- VectorVest AutoTester
- VectorVest Educational Services
- VectorVest OnLine
- VectorVest Options Analyzer
- VectorVest ProGraphics v6.0
- VectorVest ProTrader 7
- VectorVest RealTime Derby Tool
- VectorVest Simulator
- VectorVest Variator
- VectorVest Watchdog
