HOT TOPICS LIST
- MACD
- Fibonacci
- RSI
- Gann
- ADXR
- Stochastics
- Volume
- Triangles
- Futures
- Cycles
- Volatility
- ZIGZAG
- MESA
- Retracement
- Aroon
INDICATORS LIST
LIST OF TOPICS
PRINT THIS ARTICLE
by Billy Williams
Taking a larger view you can spot price patterns within key trading days that indicate new trends and emerging or potential market crashes.
Position: Hold
Billy Williams
Billy Williams has been trading the markets for 27 years, specializing in momentum trading with stocks and options.
PRINT THIS ARTICLE
STRATEGIES
The Down Friday/Down Monday Signal
06/02/11 08:17:55 AMby Billy Williams
Taking a larger view you can spot price patterns within key trading days that indicate new trends and emerging or potential market crashes.
Position: Hold
| Daily trading can allow you to experience certain lulls in trade activity, such as the triple-witching day, when stock options expire, or when companies release their earnings before the market's open, causing a maelstrom of fast-paced trading action. In fact, looking for any news item or report is often a trader's pastime, as many look at what and where the action could appear within the stock market. However, key trading days of the week can form trading patterns with huge ramifications for the market and for the smart trader who understands their significance. Understanding how and why they form can set you up to capture a new trend and, even better, signal when to cash in your chips for a huge payday. |
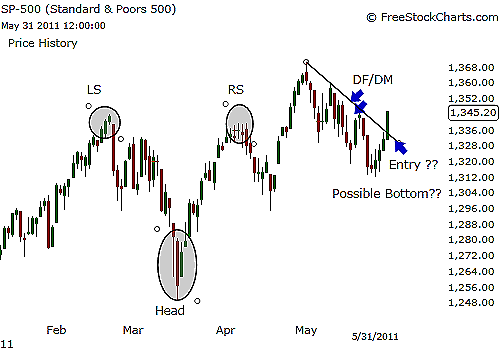
| In trading the stock market, Fridays and Mondays are the most important days of the week. Fridays are important because it's a time to exit positions or hedge your portfolio going into the weekend. Mondays are critical because if any negative news has come out and affected the market over the weekend, then it has time to digest what this news means. For more than 30 years, a down Friday followed by a down Monday has resulted in important market turning points that are followed by strong bearish price movement, often occurring as the market reaches a top of manic buying and selling just as the market falls off a cliff as a massive correction or crash follows. See Figure 1. |

|
| FIGURE 1: SPX. The SPX is at a critical point where a inverse head & shoulders has formed along with a DF/DM day within a flag pattern. All indications point up, but June, historically, is one of the weakest months for a rally. |
| Graphic provided by: www.freestockcharts.com. |
| |
| According to the Stock Trader's Almanac, a simple way to assess which way the market is heading is to keep track of the performance of the Dow Jones Industrial Average (DJIA) on Fridays and the following Mondays. Since 1995, there have been 155 occurrences of down Friday/down Monday (DF/DM), with 46 falling in the bear market years of 2001, 2002, and 2008, producing an average decline of 14.1%. Currently, the market is in a bullish trend, though weak, but trading near its annual highs. At the same time, an inverse head & shoulders pattern has formed and has had its neckline pierced by the market's upward price action, which indicates a bottoming formation has been confirmed. |
| While price has pulled back since the inverse head & shoulders pattern, you can also spot a flag pattern that has formed since the neckline has been violated. Combined with a DF/DM within that flag pattern with no selloff as a result, it appears to be a strong signal that a bottom has formed and price could advance from this price zone. |
| Now, is it a great time to go long? It is, but keep in mind that June is the weakest rally of all the four seasons. Approach the markets with a bullish bias but expect poor followthrough due to seasonal factors and adjust your price targets as well. Look to option spreads to capture income streams while the market meanders back and forth. |
Billy Williams has been trading the markets for 27 years, specializing in momentum trading with stocks and options.
| Company: | StockOptionSystem.com |
| E-mail address: | stockoptionsystem.com@gmail.com |
Traders' Resource Links | |
| StockOptionSystem.com has not added any product or service information to TRADERS' RESOURCE. | |
Click here for more information about our publications!
Comments

Request Information From Our Sponsors
- VectorVest, Inc.
- Executive Premier Workshop
- One-Day Options Course
- OptionsPro
- Retirement Income Workshop
- Sure-Fire Trading Systems (VectorVest, Inc.)
- Trading as a Business Workshop
- VectorVest 7 EOD
- VectorVest 7 RealTime/IntraDay
- VectorVest AutoTester
- VectorVest Educational Services
- VectorVest OnLine
- VectorVest Options Analyzer
- VectorVest ProGraphics v6.0
- VectorVest ProTrader 7
- VectorVest RealTime Derby Tool
- VectorVest Simulator
- VectorVest Variator
- VectorVest Watchdog
- StockCharts.com, Inc.
- Candle Patterns
- Candlestick Charting Explained
- Intermarket Technical Analysis
- John Murphy on Chart Analysis
- John Murphy's Chart Pattern Recognition
- John Murphy's Market Message
- MurphyExplainsMarketAnalysis-Intermarket Analysis
- MurphyExplainsMarketAnalysis-Visual Analysis
- StockCharts.com
- Technical Analysis of the Financial Markets
- The Visual Investor
