HOT TOPICS LIST
- MACD
- Fibonacci
- RSI
- Gann
- ADXR
- Stochastics
- Volume
- Triangles
- Futures
- Cycles
- Volatility
- ZIGZAG
- MESA
- Retracement
- Aroon
INDICATORS LIST
LIST OF TOPICS
PRINT THIS ARTICLE
by Chaitali Mohile
The technical chart of SPDR Gold Trust is likely to retrace toward its lower support.
Position: Sell
Chaitali Mohile
Active trader in the Indian stock markets since 2003 and a full-time writer. Trading is largely based upon technical analysis.
PRINT THIS ARTICLE
CHART ANALYSIS
The Reverse Journey Of Gold
06/01/11 01:33:19 PMby Chaitali Mohile
The technical chart of SPDR Gold Trust is likely to retrace toward its lower support.
Position: Sell
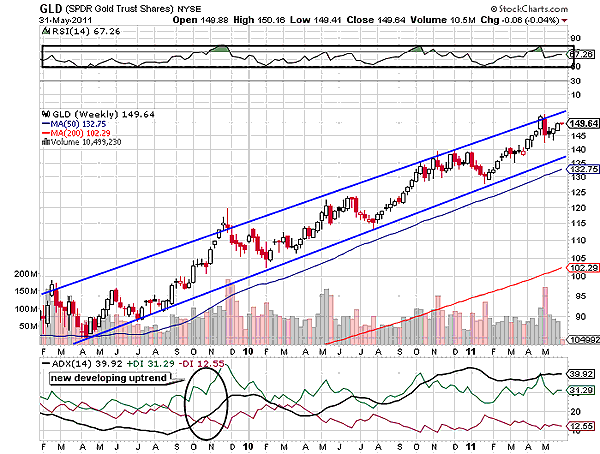
| An ascending rally of the SPDR Gold Trust Shares (GLD) has surged to 149 levels from the lower level of 90. GLD has moved in a marginally converging wedge on the weekly time frame in Figure 1. The index has plunged to a lower trendline each time it challenged an upper trendline resistance. The lower trendline is marginally converging; therefore, the wedge looks more like an ascending channel. But the higher lows of GLD formed the converging lower trendline. A bullish trend has been in charge of the rally since late 2009, dragging GLD to the new highs. We can see the average directional index (ADX) (14) and the positive directional index (+DI) has never slipped below 20 levels, indicating the healthily developing uptrend in Figure 1. |

|
| FIGURE 1: GLD, WEEKLY |
| Graphic provided by: StockCharts.com. |
| |
| However, the relative strength index (RSI) (14) is not in sync with the price rally. The oscillator has been range-bound between 50-70 levels since the very beginning of the bullish journey. Although these indicators (ADX and RSI) looked pretty supportive initially, they are reflecting bearish reversal signals in the current technical situation on the chart. GLD has moved forming higher highs and lows, but the trapped RSI (14) highlights negative divergence for GLD. The ADX (14) is about to hit overheated uptrend levels above 40. In addition, the index is ready to hit the upper trendline resistance, which would result in an intermediate corrective rally. The volume in Figure 1 is the only encouraging technical indicator that would protect the core damage of the price rally. |
| We can see the 50-day moving average (MA) support below the lower trendline; therefore, GLD is unlikely to enter a long-term bearish trend. In other words, the future bearish rally would be a technical correction of GLD. For additional reference, the uptrend on the monthly time frame is highly overheated, which could result in an intermediate bearish rally in next few weeks. Therefore, traders can trigger light short-positions once the descending rally is confirmed. The target for the bearish rally would be the lower trendline support in Figure 1. |
| Hence, GLD is likely to undergo a bearish reversal journey in the next few sessions. |
Active trader in the Indian stock markets since 2003 and a full-time writer. Trading is largely based upon technical analysis.
| Company: | Independent |
| Address: | C1/3 Parth Indraprasth Towers. Vastrapur |
| Ahmedabad, Guj 380015 | |
| E-mail address: | chaitalimohile@yahoo.co.in |
Traders' Resource Links | |
| Independent has not added any product or service information to TRADERS' RESOURCE. | |
Click here for more information about our publications!
Comments

Request Information From Our Sponsors
- StockCharts.com, Inc.
- Candle Patterns
- Candlestick Charting Explained
- Intermarket Technical Analysis
- John Murphy on Chart Analysis
- John Murphy's Chart Pattern Recognition
- John Murphy's Market Message
- MurphyExplainsMarketAnalysis-Intermarket Analysis
- MurphyExplainsMarketAnalysis-Visual Analysis
- StockCharts.com
- Technical Analysis of the Financial Markets
- The Visual Investor
- VectorVest, Inc.
- Executive Premier Workshop
- One-Day Options Course
- OptionsPro
- Retirement Income Workshop
- Sure-Fire Trading Systems (VectorVest, Inc.)
- Trading as a Business Workshop
- VectorVest 7 EOD
- VectorVest 7 RealTime/IntraDay
- VectorVest AutoTester
- VectorVest Educational Services
- VectorVest OnLine
- VectorVest Options Analyzer
- VectorVest ProGraphics v6.0
- VectorVest ProTrader 7
- VectorVest RealTime Derby Tool
- VectorVest Simulator
- VectorVest Variator
- VectorVest Watchdog
