HOT TOPICS LIST
- MACD
- Fibonacci
- RSI
- Gann
- ADXR
- Stochastics
- Volume
- Triangles
- Futures
- Cycles
- Volatility
- ZIGZAG
- MESA
- Retracement
- Aroon
INDICATORS LIST
LIST OF TOPICS
PRINT THIS ARTICLE
by Billy Williams
In an ever-changing market, if you hope to achieve outsized gains, then you need to consider using the six-month switching and timing strategy.
Position: Hold
Billy Williams
Billy Williams has been trading the markets for 27 years, specializing in momentum trading with stocks and options.
PRINT THIS ARTICLE
STRATEGIES
Six-Month Switching And Timing Strategy
06/01/11 08:33:57 AMby Billy Williams
In an ever-changing market, if you hope to achieve outsized gains, then you need to consider using the six-month switching and timing strategy.
Position: Hold
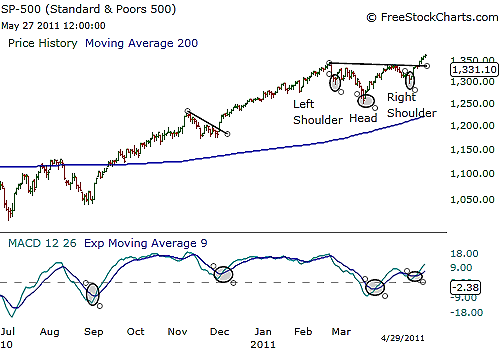
| May can be a tricky month to navigate, and with one glance at the present state of the market, you can confirm that it's true; this is the one constant in that the market is ever dynamic, and that is why you need to be flexible in your trading strategy if you aspire to maximize your returns and minimize your risks. Trading strategy does not mean the same thing as an approach or system inasmuch that approaches or systems are tactics to fulfill a strategy of seeking highest gains possible. For example, if you adopt a strategy to only trade when the odds are overwhelmingly in your favor, then you need to adopt key tactics that will help you carry out that strategy. In order to carry that out, you must first look at both the probabilities and facts that support what you want to accomplish and then integrate trading approaches at a tactical level. See Figure 1. |

|
| FIGURE 1: S&P 500. Starting in October 2010, the SPX went on to gain 220 points with several buy signals confirmed with the MACD. This six-month period combined with the MACD as a long confirmation has been an effective mechanical system for achieving large gains over several decades. |
| Graphic provided by: www.freestockcharts.com. |
| |
| A good place to look is at the six-month switching as detailed in "The Stock Trader's Almanac." This method delivers on a consistent basis over time because although markets are ever dynamic, there exists a paradox that reveals key patterns within the stock market's price action to support such a strategy. By investing in the Dow Jones Industrial Average (DJIA) between November 1 and April 30 each year and then switching into fixed income for the other six months, this method has produced reliable returns with reduced risk since 1950. Close observation of these six consecutive months shows a gain of 11703.60 DJIA points in 60 years, while the remaining May through October months lost 909.32 points. "The Stock Trader's Almanac" goes on to report, "The S&P gained 1153.9 points in the same best six months versus just 16.03 points in the worst six." The almanac goes into greater detail. |
| Using the simple the moving average convergence/divergence (MACD) to better time entries and exits into and out of this six-month period nearly triples the results. |
| While using this method will not produce a high amount of trades, it will, however, produce a small number of extremely high-quality trades. Couple that with an approach that uses highly probable statistics supported by the very momentum of historical price action, and you have an approach to fulfill a strategy of maximum returns while lowering your risk. |
Billy Williams has been trading the markets for 27 years, specializing in momentum trading with stocks and options.
| Company: | StockOptionSystem.com |
| E-mail address: | stockoptionsystem.com@gmail.com |
Traders' Resource Links | |
| StockOptionSystem.com has not added any product or service information to TRADERS' RESOURCE. | |
Click here for more information about our publications!
PRINT THIS ARTICLE

Request Information From Our Sponsors
- StockCharts.com, Inc.
- Candle Patterns
- Candlestick Charting Explained
- Intermarket Technical Analysis
- John Murphy on Chart Analysis
- John Murphy's Chart Pattern Recognition
- John Murphy's Market Message
- MurphyExplainsMarketAnalysis-Intermarket Analysis
- MurphyExplainsMarketAnalysis-Visual Analysis
- StockCharts.com
- Technical Analysis of the Financial Markets
- The Visual Investor
- VectorVest, Inc.
- Executive Premier Workshop
- One-Day Options Course
- OptionsPro
- Retirement Income Workshop
- Sure-Fire Trading Systems (VectorVest, Inc.)
- Trading as a Business Workshop
- VectorVest 7 EOD
- VectorVest 7 RealTime/IntraDay
- VectorVest AutoTester
- VectorVest Educational Services
- VectorVest OnLine
- VectorVest Options Analyzer
- VectorVest ProGraphics v6.0
- VectorVest ProTrader 7
- VectorVest RealTime Derby Tool
- VectorVest Simulator
- VectorVest Variator
- VectorVest Watchdog
