HOT TOPICS LIST
- MACD
- Fibonacci
- RSI
- Gann
- ADXR
- Stochastics
- Volume
- Triangles
- Futures
- Cycles
- Volatility
- ZIGZAG
- MESA
- Retracement
- Aroon
INDICATORS LIST
LIST OF TOPICS
PRINT THIS ARTICLE
by Koos van der Merwe
I have always stated that we must follow the first rule of Elliott wave: The wave must look correct. That the Elliott wave is nothing more than a signpost can change a little way down the road.
Position: Hold
Koos van der Merwe
Has been a technical analyst since 1969, and has worked as a futures and options trader with First Financial Futures in Johannesburg, South Africa.
PRINT THIS ARTICLE
ELLIOTT WAVE
When A Wave Count Becomes Complicated
05/31/11 08:15:13 AMby Koos van der Merwe
I have always stated that we must follow the first rule of Elliott wave: The wave must look correct. That the Elliott wave is nothing more than a signpost can change a little way down the road.
Position: Hold
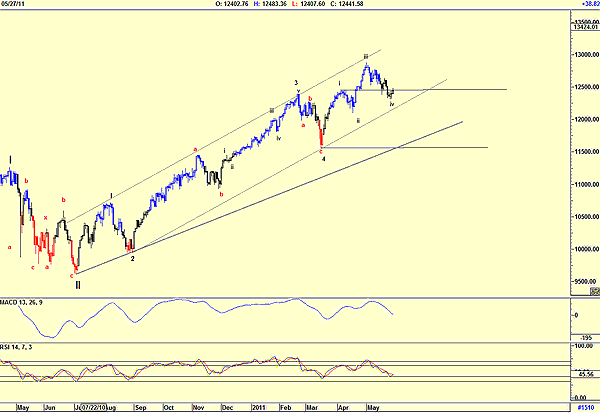
| What happens when it does not look correct? What do you do to decide which is the correct wave count? We are seeing this happen with the Dow Jones at the moment. No matter how much I look at the daily chart, I simply cannot come to the correct wave count. The wave count that seems correct looks wrong. It does not follow the first rule! And that is troubling. Do note that the relative strength index (RSI) is not in a buy zone, but how important that is at the moment is debatable. |

|
| FIGURE 1: DJIA, DAILY. Here's the original daily wave count of the Dow Jones. |
| Graphic provided by: AdvancedGET. |
| |
| A look at Figure 1 shows a count that I completed a number of weeks ago, with an "a-b" count occurring in wave 3 of wave III. My count of wave 5 of wave III, however, no longer looks right, with wave IV of wave 5 falling below the high of wave i of wave 5. This forces me to revise my wave count. Do note that the RSI is not in a buy zone, but how important that is at the moment is debatable. |

|
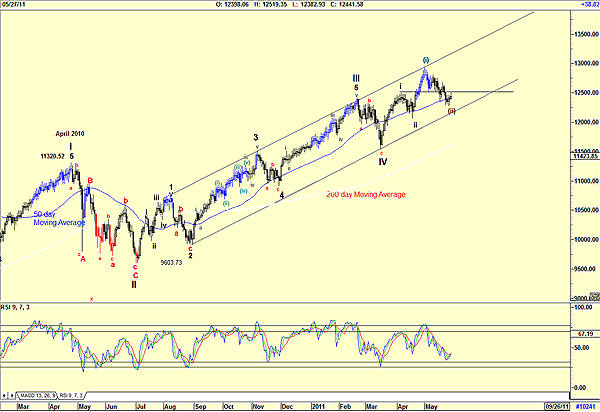
| FIGURE 2: DJIA, DAILY. Here's the new daily wave count of the Dow Jones, |
| Graphic provided by: AdvancedGET. |
| |
| In Figure 2, I have changed the count suggesting that wave III is complete and that the DJIA is now tracing wave (iii) of wave iii of wave V. The reason for this count is because wave (ii) fell below the high of wave i, which meant the the wave (i) - wave (ii) correction could simply not be a wave iii - wave iv correction. I have also reduced the RSI parameter from 14 to 10. This does bring all the buy signals into view on the RSI horizontals. However, the RSI has not yet given a buy signal, suggesting that we could still see further downside with the DJIA possibly testing the support line. |

|
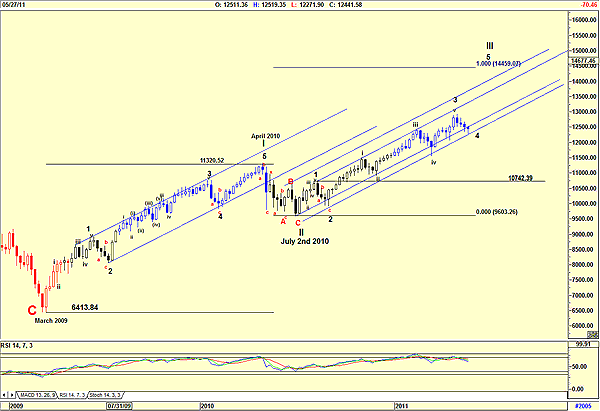
| FIGURE 3: DJIA, WEEKLY. Here's the weekly wave count of the Dow Jones. |
| Graphic provided by: AdvancedGET. |
| |
| Figure 3 is a weekly chart of the DJIA. This chart does suggest that the DJIA could be in the final stages of a Wave 4 correction of wave III, with a target for Wave 5 wave III of 14459.07. The wave count on the weekly chart looks correct, even though the RSI is in overbought territory. This does suggest that the start of wave 5 could be slow. With the "Sell in May and go away" mantra on everyone's mind, and with caution as to economic recovery both at home and abroad, the start and completion of Wave 5 of wave III could be painful. However, the chart also suggests that as long as the DJIA does not fall below 10742.39, the top of Wave 1 of wave III, the correct wave count on a weekly chart is still in place. The weekly Elliott wave count does look correct. The daily chart, however, has many possibilities still open to it, and one will only know the true daily wave count when it is completed. |
Has been a technical analyst since 1969, and has worked as a futures and options trader with First Financial Futures in Johannesburg, South Africa.
| Address: | 3256 West 24th Ave |
| Vancouver, BC | |
| Phone # for sales: | 6042634214 |
| E-mail address: | petroosp@gmail.com |
Click here for more information about our publications!
Comments
Date: 06/08/11Rank: 5Comment: Koos:
This market is Ugly... We surely are on our way to 10749.
Hope you are doing well.
Regards,
Dick Slayton

Request Information From Our Sponsors
- VectorVest, Inc.
- Executive Premier Workshop
- One-Day Options Course
- OptionsPro
- Retirement Income Workshop
- Sure-Fire Trading Systems (VectorVest, Inc.)
- Trading as a Business Workshop
- VectorVest 7 EOD
- VectorVest 7 RealTime/IntraDay
- VectorVest AutoTester
- VectorVest Educational Services
- VectorVest OnLine
- VectorVest Options Analyzer
- VectorVest ProGraphics v6.0
- VectorVest ProTrader 7
- VectorVest RealTime Derby Tool
- VectorVest Simulator
- VectorVest Variator
- VectorVest Watchdog
- StockCharts.com, Inc.
- Candle Patterns
- Candlestick Charting Explained
- Intermarket Technical Analysis
- John Murphy on Chart Analysis
- John Murphy's Chart Pattern Recognition
- John Murphy's Market Message
- MurphyExplainsMarketAnalysis-Intermarket Analysis
- MurphyExplainsMarketAnalysis-Visual Analysis
- StockCharts.com
- Technical Analysis of the Financial Markets
- The Visual Investor
