HOT TOPICS LIST
- MACD
- Fibonacci
- RSI
- Gann
- ADXR
- Stochastics
- Volume
- Triangles
- Futures
- Cycles
- Volatility
- ZIGZAG
- MESA
- Retracement
- Aroon
INDICATORS LIST
LIST OF TOPICS
PRINT THIS ARTICLE
by Gary Grosschadl
My previous article showed a compelling inverse relationship between VIX and the Nasdaq on the daily chart. How does this hold up on a weekly chart ?
Position: N/A
Gary Grosschadl
Independent Canadian equities trader and technical analyst based in Peterborough
Ontario, Canada.
PRINT THIS ARTICLE
VIX / Nasdaq Weekly Timing Model
03/22/02 09:28:42 AMby Gary Grosschadl
My previous article showed a compelling inverse relationship between VIX and the Nasdaq on the daily chart. How does this hold up on a weekly chart ?
Position: N/A
| It would make sense that the longer term weekly chart should offer some kind of confirmation to the daily perspective and it does via a slightly different path. |
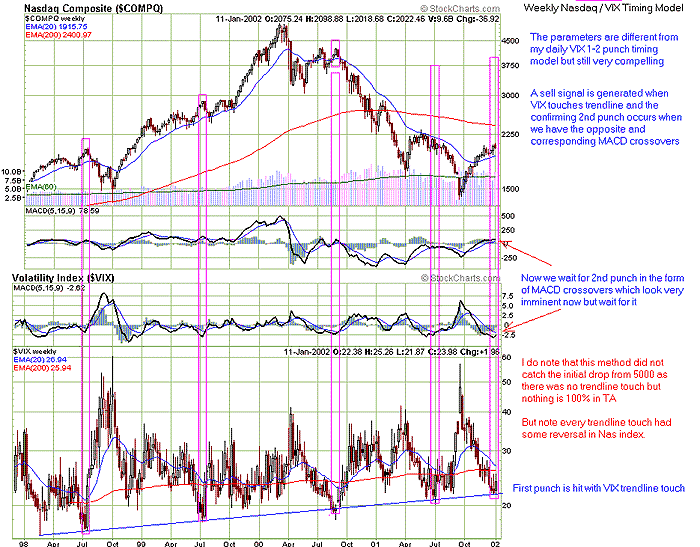
| Here I use MACD (moving average convergence/divergence) to help time this model once again to the VIX chart. As a shorter term trader I prefer the quicker setting of 5-15-9 vs the default setting many use of 12-26-9. I still use the One-Two Punch concept as follows: First punch (signal) hit when VIX touches the trendline and the confirming second punch occurs when we have corresponding MACD crossovers for both VIX and Nasdaq. Aggressive traders may want to move earlier, perhaps using the first MACD cross from either Nasdaq or VIX. They seem to cross very close to one another which makes sense when you see how close this inverse relationship holds. |

|
| Weekly Nasaq / VIX Timing Model |
| Graphic provided by: stockcharts.com. |
| |
| As you can see this chart was created on January 11, 2002, when I was particularily concerned with a coming downleg. We all know what happened next, the Nasdaq quickly proceeded to give up about 300 points in a downleg. And yes, that second timing punch registered as expected. |
| In my next two articles I will show where these imminent downleg "feelings" came from, using candlesticks and indicators- An interesting look back. |
Independent Canadian equities trader and technical analyst based in Peterborough
Ontario, Canada.
| Website: | www.whatsonsale.ca/financial.html |
| E-mail address: | gwg7@sympatico.ca |
Click here for more information about our publications!
Comments
Date: 03/26/02Rank: 5Comment:
Date: 04/02/02Rank: 5Comment:

Request Information From Our Sponsors
- StockCharts.com, Inc.
- Candle Patterns
- Candlestick Charting Explained
- Intermarket Technical Analysis
- John Murphy on Chart Analysis
- John Murphy's Chart Pattern Recognition
- John Murphy's Market Message
- MurphyExplainsMarketAnalysis-Intermarket Analysis
- MurphyExplainsMarketAnalysis-Visual Analysis
- StockCharts.com
- Technical Analysis of the Financial Markets
- The Visual Investor
- VectorVest, Inc.
- Executive Premier Workshop
- One-Day Options Course
- OptionsPro
- Retirement Income Workshop
- Sure-Fire Trading Systems (VectorVest, Inc.)
- Trading as a Business Workshop
- VectorVest 7 EOD
- VectorVest 7 RealTime/IntraDay
- VectorVest AutoTester
- VectorVest Educational Services
- VectorVest OnLine
- VectorVest Options Analyzer
- VectorVest ProGraphics v6.0
- VectorVest ProTrader 7
- VectorVest RealTime Derby Tool
- VectorVest Simulator
- VectorVest Variator
- VectorVest Watchdog
