

HOT TOPICS LIST
- MACD
- Fibonacci
- RSI
- Gann
- ADXR
- Stochastics
- Volume
- Triangles
- Futures
- Cycles
- Volatility
- ZIGZAG
- MESA
- Retracement
- Aroon
INDICATORS LIST
LIST OF TOPICS
PRINT THIS ARTICLE
by Chaitali Mohile
The long-term bullish breakout of the semiconductor index has turned sideways. Will it attract fresh bearish interest?
Position: N/A
Chaitali Mohile
Active trader in the Indian stock markets since 2003 and a full-time writer. Trading is largely based upon technical analysis.
PRINT THIS ARTICLE
CHART ANALYSIS
$SOX Under Pressure?
05/27/11 12:55:25 PMby Chaitali Mohile
The long-term bullish breakout of the semiconductor index has turned sideways. Will it attract fresh bearish interest?
Position: N/A
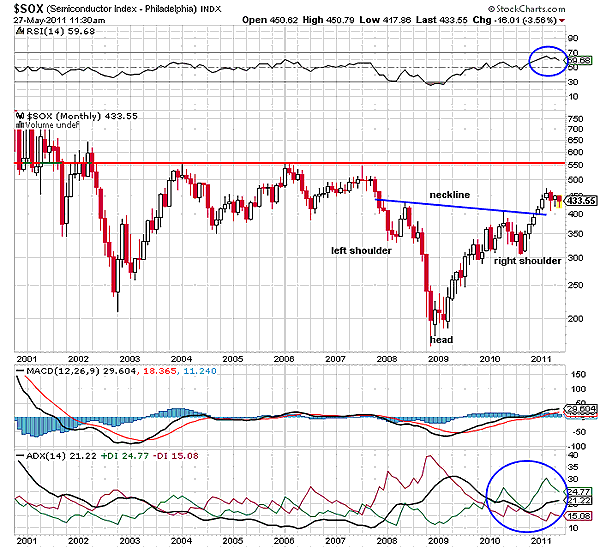
| The semiconductor index ($SOX) formed an inverted head & shoulders -- a major bullish trend reversal formation -- on its monthly chart in Figure 1.The declining neckline resistance was breached at 400 levels in January 2011. A bearish trend indicated by the average directional index (ADX) (14) reversed during a bullish breakout of the head & shoulders pattern. A fresh bullish trend developed, with marginal increase in the buying pressure. As a result, the bullish breakout of $SOX could hardly surge above the breakout level. As we can see in Figure 1, $SOX turned sideways at 450 levels, indicating a weakness. The relative strength index (RSI) (14) tipped down, showing a reluctance to breach an overbought level. |
|
| FIGURE 1: $SOX, MONTHLY. The bullish breakout of an inverted head & shoulders pattern turned sideways after rallying a few points from the neckline support. |
| Graphic provided by: StockCharts.com. |
| |
| The gap between the moving average convergence/divergence (MACD) line and the trigger line is very narrow, thus reflecting high volatility. Although an inverted head & shoulders is one of the reliable patterns, the weak oscillators in Figure 1 spoiled the bullish breakout rally of $SOX. The index has been consolidating for about three months. The previous highs on the price chart formed robust resistance at 550 levels. The support-resistance line tool is used in Figure 1 to highlight the strong resistance at 550 levels. Considering the weak indicators and the resistance, $SOX is likely to retrace toward the neckline support at 400 levels. |
|
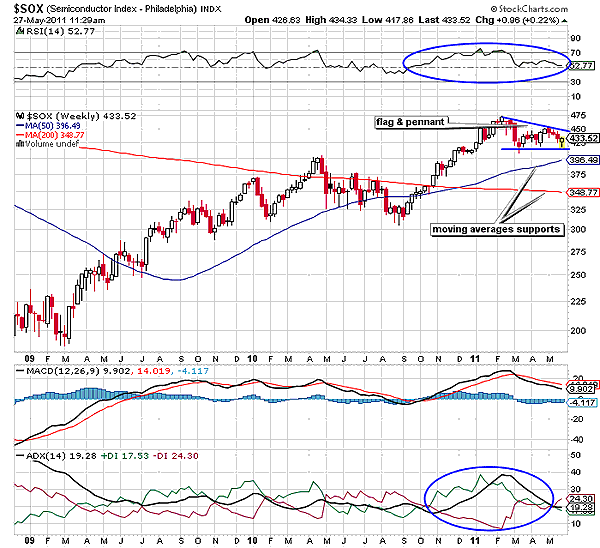
| FIGURE 2: $SOX, WEEKLY. The descending flag of the flag & pennant formation reflects weakness in the consolidation range. |
| Graphic provided by: StockCharts.com. |
| |
| On the weekly time frame in Figure 2, $SOX moved sideways due to an overheated uptrend. The weakening bullish trend strengthened the bears waiting to capture the rally. Hence, the consolidation witnessed lower peaks and the stable bottoms at 420 levels. Though a flag & pennant formation is visible in Figure 2, the lower highs reflect bearish force in the range-bound rally. In addition, the ADX (14) is showing conflict between the buying and selling pressure, showing more volatility in the current price action. An intermediate downtrend is yet to develop because the trend indicator is below 20 levels. After a bearish crossover, the MACD (12,26,9) has turned negative. The RSI (14) has plunged to 50 levels, and therefore, we have to stay watchful. If the oscillator establishes support at the center line, $SOX would gain bullish strength. |
| Currently, the monthly as well as weekly charts of $SOX are weak and likely to plunge to challenge the nearest support at 400 levels. The ongoing turbulence in the financial markets across the globe would add bearish pressure in the consolidation rally of $SOX. |
Active trader in the Indian stock markets since 2003 and a full-time writer. Trading is largely based upon technical analysis.
| Company: | Independent |
| Address: | C1/3 Parth Indraprasth Towers. Vastrapur |
| Ahmedabad, Guj 380015 | |
| E-mail address: | chaitalimohile@yahoo.co.in |
Traders' Resource Links | |
| Independent has not added any product or service information to TRADERS' RESOURCE. | |
Click here for more information about our publications!
PRINT THIS ARTICLE

Request Information From Our Sponsors
- StockCharts.com, Inc.
- Candle Patterns
- Candlestick Charting Explained
- Intermarket Technical Analysis
- John Murphy on Chart Analysis
- John Murphy's Chart Pattern Recognition
- John Murphy's Market Message
- MurphyExplainsMarketAnalysis-Intermarket Analysis
- MurphyExplainsMarketAnalysis-Visual Analysis
- StockCharts.com
- Technical Analysis of the Financial Markets
- The Visual Investor
- VectorVest, Inc.
- Executive Premier Workshop
- One-Day Options Course
- OptionsPro
- Retirement Income Workshop
- Sure-Fire Trading Systems (VectorVest, Inc.)
- Trading as a Business Workshop
- VectorVest 7 EOD
- VectorVest 7 RealTime/IntraDay
- VectorVest AutoTester
- VectorVest Educational Services
- VectorVest OnLine
- VectorVest Options Analyzer
- VectorVest ProGraphics v6.0
- VectorVest ProTrader 7
- VectorVest RealTime Derby Tool
- VectorVest Simulator
- VectorVest Variator
- VectorVest Watchdog