

HOT TOPICS LIST
- MACD
- Fibonacci
- RSI
- Gann
- ADXR
- Stochastics
- Volume
- Triangles
- Futures
- Cycles
- Volatility
- ZIGZAG
- MESA
- Retracement
- Aroon
INDICATORS LIST
LIST OF TOPICS
PRINT THIS ARTICLE
by Alan R. Northam
ConocoPhillips is currently in an established intermediate-term bear market trend. Is the first leg down complete or does it have further to go? Statistical analysis is used to explain.
Position: N/A
Alan R. Northam
Alan Northam lives in the Dallas, Texas area and as an electronic engineer gave him an analytical mind from which he has developed a thorough knowledge of stock market technical analysis. His abilities to analyze the future direction of the stock market has allowed him to successfully trade of his own portfolio over the last 30 years. Mr. Northam is now retired and trading the stock market full time. You can reach him at inquiry@tradersclassroom.com or by visiting his website at http://www.tradersclassroom.com. You can also follow him on Twitter @TradersClassrm.
PRINT THIS ARTICLE
STATISTICS
ConocoPhillips Completes First Leg Down?
05/27/11 08:23:23 AMby Alan R. Northam
ConocoPhillips is currently in an established intermediate-term bear market trend. Is the first leg down complete or does it have further to go? Statistical analysis is used to explain.
Position: N/A
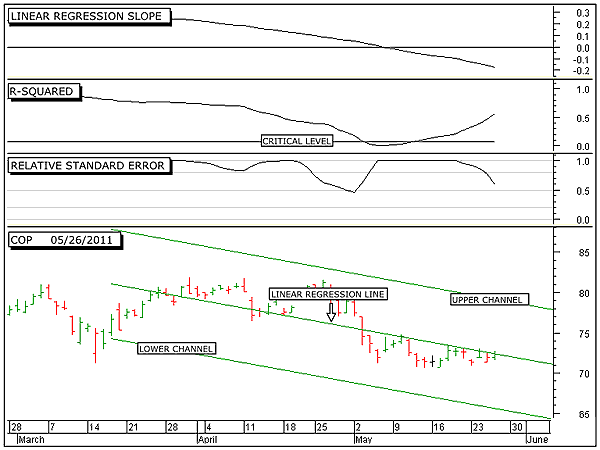
| On May 5, I wrote an article entitled "ConocoPhillips Becomes A Weak Bull." In that article I presented a statistical analysis showing that the upward bullish trend in ConocoPhillips had become weak. I also wrote that all price had to do to enter into a strong bear trend was for the 50-day linear regression slope indicator to fall below its zero line and for the R-squared indicator to move above its critical level. Moving forward six trading days, in Figure 1 price moved below its zero line and the R-squared indicator moved above its critical level, signaling that ConocoPhillips had become a strong bull. |
| Looking closer at Figure 1, note that the linear regression slope indicator continues to point down, indicating that price continues to accelerate downward. This was an indication that price should continue to move lower in the days ahead. Note also that the R-squared indicator continues to move upward. This is an indication that the bearish trend of ConocoPhillips is continuing to strengthen and is also an indication that the bearish trend of ConocoPhillips should continue. In addition, the relative standard error index (RSEI) has been moving lower, signaling that volatility is starting to subside as the price movement of COP is settling down into its new downtrend. |
|
| FIGURE 1: COP, DAILY. This chart shows the daily price chart in the bottom panel along with the 50-day linear regression trendline, the linear regression slope indicator in the top panel, and the R-squared indicator in the second panel. |
| Graphic provided by: MetaStock. |
| |
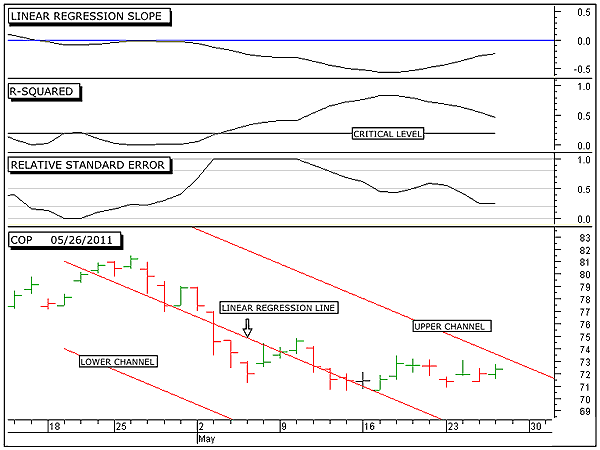
| While the 50-day time frame shows that ConocoPhillips has now established itself in a new bear market downtrend, the shorter 20-day time frame shows that the first downward leg of the bear market could be nearing an end. Figure 2 shows the 20-day linear regression trendline along with its upper and lower two sigma channel lines. Note that over the last 10 trading days or so, price has been moving sideways away from the linear regression line (middle red line) and toward the upper channel line. This upper channel line normally acts as a line of resistance to price, and price should start to turn back downward. However, should price break out above the upper linear regression channel line, it will signal that price is starting to move upward over the short term. If price does start to rally upward, it could rally up to the upper 50-day linear regression channel line (see Figure 1) before turning downward to start the next intermediate-term leg. |
| Looking closer at Figure 2, note that the linear regression slope indicator has bottomed and is now pointing in an upward direction. This signals the period of price deceleration. Price deceleration normally occurs just before a reversal in trend and is warning traders that a short-term reversal in price could be just ahead. Looking at the R-squared indicator, note that it has peaked and is now moving lower. This is an indication that the strength of the short-term downtrend is weakening. Thus, the linear regression slope indicator and the R-squared indicator point to the possibility that price will reverse higher over the short term. However, note the relative standard error index. This index continues to point downward and is below 0.5 and just above 0.2, indicating below-average volatility. Normally, when price is near the end of its trend and is ready to reverse its direction, volatility is on the rise. Thus, RSEI is sending a conflicting signal from the linear regression slope indicator and the R-squared indicator. Normally, conflicting signals are bearish, and therefore, these indicators are calling for the continuation of the intermediate-term downtrend. |
|
| FIGURE 2: COP, DAILY. This chart shows the daily price chart in the bottom panel along with the 20-day linear regression trendline, the linear regression slope indicator in the top panel, and the R-squared indicator in the second panel. |
| Graphic provided by: MetaStock. |
| |
| In conclusion, ConocoPhillips (COP) is currently in an intermediate-term downtrend. However, there is a possibility that over the short term, price may rally upward before continuing lower. Should price move above the 20-day upper linear regression channel line, then expect price to move upward over the short term. However, this short-term rally most likely will not make a new higher high but rather a lower high. Should price respect the 20-day upper linear regression channel line and turn back down before crossing through and above it, then price will most likely continue lower from current price levels. |
Alan Northam lives in the Dallas, Texas area and as an electronic engineer gave him an analytical mind from which he has developed a thorough knowledge of stock market technical analysis. His abilities to analyze the future direction of the stock market has allowed him to successfully trade of his own portfolio over the last 30 years. Mr. Northam is now retired and trading the stock market full time. You can reach him at inquiry@tradersclassroom.com or by visiting his website at http://www.tradersclassroom.com. You can also follow him on Twitter @TradersClassrm.
| Garland, Tx | |
| Website: | www.tradersclassroom.com |
| E-mail address: | inquiry@tradersclassroom.com |
Click here for more information about our publications!
PRINT THIS ARTICLE

Request Information From Our Sponsors
- StockCharts.com, Inc.
- Candle Patterns
- Candlestick Charting Explained
- Intermarket Technical Analysis
- John Murphy on Chart Analysis
- John Murphy's Chart Pattern Recognition
- John Murphy's Market Message
- MurphyExplainsMarketAnalysis-Intermarket Analysis
- MurphyExplainsMarketAnalysis-Visual Analysis
- StockCharts.com
- Technical Analysis of the Financial Markets
- The Visual Investor
- VectorVest, Inc.
- Executive Premier Workshop
- One-Day Options Course
- OptionsPro
- Retirement Income Workshop
- Sure-Fire Trading Systems (VectorVest, Inc.)
- Trading as a Business Workshop
- VectorVest 7 EOD
- VectorVest 7 RealTime/IntraDay
- VectorVest AutoTester
- VectorVest Educational Services
- VectorVest OnLine
- VectorVest Options Analyzer
- VectorVest ProGraphics v6.0
- VectorVest ProTrader 7
- VectorVest RealTime Derby Tool
- VectorVest Simulator
- VectorVest Variator
- VectorVest Watchdog