HOT TOPICS LIST
- MACD
- Fibonacci
- RSI
- Gann
- ADXR
- Stochastics
- Volume
- Triangles
- Futures
- Cycles
- Volatility
- ZIGZAG
- MESA
- Retracement
- Aroon
INDICATORS LIST
LIST OF TOPICS
PRINT THIS ARTICLE
by Donald W. Pendergast, Jr.
When developing and testing various trading systems, learn to identify the most desirable kinds of equity curves.
Position: N/A
Donald W. Pendergast, Jr.
Donald W. Pendergast is a financial markets consultant who offers specialized services to stock brokers and high net worth individuals who seek a better bottom line for their portfolios.
PRINT THIS ARTICLE
TRADING SYSTEMS
A Tale Of Two Equity Curves
05/27/11 07:58:13 AMby Donald W. Pendergast, Jr.
When developing and testing various trading systems, learn to identify the most desirable kinds of equity curves.
Position: N/A
| This article deals with a basic, foundational principle that every serious system developer and trader needs to be aware of, and that is the need for a relatively flat, steadily rising equity curve in both in-sample and out-of-sample testing periods. We'll look at two systems, each designed to run on a very specific market and time frame, and then see if we can't learn a thing or two from basic visual analysis of the two systems' equity curves. |

|
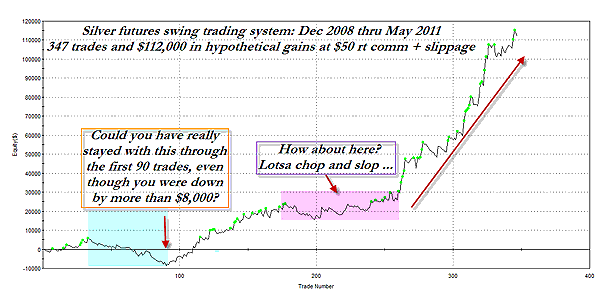
| FIGURE 1: SILVER SWING TRADING SYSTEM. Large gains that come in periodic spurts can be a lot of fun, but can you also deal with the inevitable periods of negative to sideways equity curve growth? |
| Graphic provided by: TradeStation. |
| |
| The silver market enjoyed a steady bull market from 2001 to 2008 and then from 2009 until April 2011, making tons of profits for patient, long-term investors along the way (Figure 1). The system equity curve shown is from a silver futures swing trading system that I developed and it includes both in-sample and out-of-sample testing periods. While the spectacular growth rate of the hypothetical system is impressive ($112,165 in gains over a 30-month period in 347 trades), note how undulating and indecisive the equity curve is during the first 90 trades; the system had a drawdown of nearly $9,000 in the first seven months. Sure, a patient system trader would have done just fine (preferably by trading an entire basket of noncorrelated systems, of which this would have been only one) by staying with it, but how many real-world traders could have dealt with the frustration of the initial losing streak? Not many, I'd wager. That's because at the worst part of the drawdown, there isn't a soul alive who could have foretold the stunning gains this system would eventually produce for the faithful traders who stayed with it. Now you know at least one of the reasons why it's so hard for a trader to stick with a system for a long period of time. But what if you were shopping for a system and discovered one that was steadier in its rate of equity curve growth, even though it was substantially less profitable overall? |

|
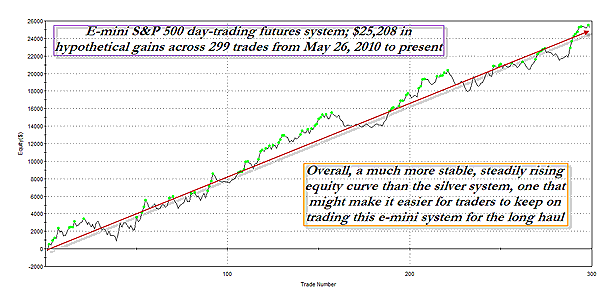
| FIGURE 2: EMINI S&P 500 SYSTEM. Alternatively, a less profitable system that provides less of a roller-coaster ride for those trading it might be just the ticket for those needing help in staying with a system for the long haul. |
| Graphic provided by: TradeStation. |
| |
| And that's what's depicted in Figure 2, the equity curve of a Standard & Poor's 500 emini futures daytrading system, also designed by yours truly. In hypothetical testing (in-sample and out-of-sample), it generated over $25,000 across 299 trades in the most recent calendar year. And even though this rate of equity growth falls substantially short of the total and per-annum gains in the previously mentioned silver futures trading system, the fact that this emini daytrading system can generate such a pleasing equity curve -- and with no overnight holding of positions, to boot -- while still producing above-average gains might make it of serious interest to traders seeking a more stable way to grow their trading capital. Certainly, a smaller capitalized trader would want to trade only the emini system, all else being equal, while a well-capitalized trader might want to deploy both systems in an attempt to generate outsized annual gains with a combined equity curve that is still easy on the eyes -- and trading psyche. |
| So when shopping for a system, by all means look for solid profitability figures, but then also check to see if its combined in- and out-of-sample equity curve lines are going to be easy to live with, day in and day out. You're only going to be able to stick with a system you truly believe in, so make sure the equity curve has a shape that is easy on the eyes and on your emotions. It really matters, so take your time when shopping for your next system. |
Donald W. Pendergast is a financial markets consultant who offers specialized services to stock brokers and high net worth individuals who seek a better bottom line for their portfolios.
| Title: | Writer, market consultant |
| Company: | Linear Trading Systems LLC |
| Jacksonville, FL 32217 | |
| Phone # for sales: | 904-239-9564 |
| E-mail address: | lineartradingsys@gmail.com |
Traders' Resource Links | |
| Linear Trading Systems LLC has not added any product or service information to TRADERS' RESOURCE. | |
Click here for more information about our publications!
PRINT THIS ARTICLE

Request Information From Our Sponsors
- StockCharts.com, Inc.
- Candle Patterns
- Candlestick Charting Explained
- Intermarket Technical Analysis
- John Murphy on Chart Analysis
- John Murphy's Chart Pattern Recognition
- John Murphy's Market Message
- MurphyExplainsMarketAnalysis-Intermarket Analysis
- MurphyExplainsMarketAnalysis-Visual Analysis
- StockCharts.com
- Technical Analysis of the Financial Markets
- The Visual Investor
- VectorVest, Inc.
- Executive Premier Workshop
- One-Day Options Course
- OptionsPro
- Retirement Income Workshop
- Sure-Fire Trading Systems (VectorVest, Inc.)
- Trading as a Business Workshop
- VectorVest 7 EOD
- VectorVest 7 RealTime/IntraDay
- VectorVest AutoTester
- VectorVest Educational Services
- VectorVest OnLine
- VectorVest Options Analyzer
- VectorVest ProGraphics v6.0
- VectorVest ProTrader 7
- VectorVest RealTime Derby Tool
- VectorVest Simulator
- VectorVest Variator
- VectorVest Watchdog
