HOT TOPICS LIST
- MACD
- Fibonacci
- RSI
- Gann
- ADXR
- Stochastics
- Volume
- Triangles
- Futures
- Cycles
- Volatility
- ZIGZAG
- MESA
- Retracement
- Aroon
INDICATORS LIST
LIST OF TOPICS
PRINT THIS ARTICLE
by Koos van der Merwe
Diamonds are a girl's best friend, so goes the song. Are they a trader's, though?
Position: Sell
Koos van der Merwe
Has been a technical analyst since 1969, and has worked as a futures and options trader with First Financial Futures in Johannesburg, South Africa.
PRINT THIS ARTICLE
THE DIAMOND
Are Diamond Patterns Friend Or Foe?
05/26/11 03:33:26 PMby Koos van der Merwe
Diamonds are a girl's best friend, so goes the song. Are they a trader's, though?
Position: Sell
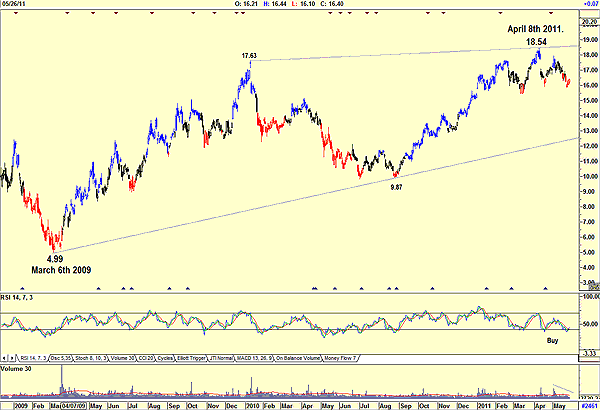
| Diamonds may be a girl's best friend, but when a diamond pattern appears on a chart, the word "caution" should flash in your head. As an example, look at the chart of Alcoa, which is tracing a diamond pattern. Alcoa is involved in the production and management of aluminum, fabricated aluminum, and alumina. The company has had a volatile share price movement, trading between $18 and $45. Then, starting June 2008, the price plunged to a low of $5.00 by March 2009. Since that date, the price has recovered. |

|
| FIGURE 1: ALCOA, DAILY. Here's a chart of Alcoa showing the trend. |
| Graphic provided by: AdvancedGET. |
| |
| Figure 1 shows how the price of the share recovered from a low of $4.99 on March 6, 2009, to a high of $18.54 by April 8, 2011, a very nice return of 271%. So what now? The relative strength index (RSI) has given a buy signal. |

|
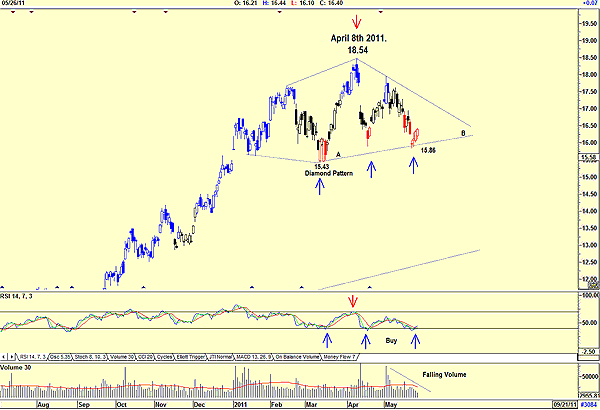
| FIGURE 2: ALCOA, DAILY. Here's a chart of Alcoa showing a diamond pattern. |
| Graphic provided by: AdvancedGET. |
| |
| Figure 2, which is also a daily chart, highlights the diamond pattern that has formed. Note the RSI buy signals with only one RSI sell signal. Note also the falling volume as price fell, usually a sign of strength. However, the last three days of up trading have also been on falling volume, suggesting weakness ahead. The two pivot points of $15.43 and $15.86 offer resistance levels, as does the lower support line A-B. By all accounts, the share price should rise on the RSI buy signal and it probably will, so short-term traders could make a comfortable profit. However, long-term investors should be cautious. Diamond patterns are notorious for being reverse signals. An interesting pattern to watch, but a pattern that shouts caution. |
Has been a technical analyst since 1969, and has worked as a futures and options trader with First Financial Futures in Johannesburg, South Africa.
| Address: | 3256 West 24th Ave |
| Vancouver, BC | |
| Phone # for sales: | 6042634214 |
| E-mail address: | petroosp@gmail.com |
Click here for more information about our publications!
PRINT THIS ARTICLE

Request Information From Our Sponsors
- VectorVest, Inc.
- Executive Premier Workshop
- One-Day Options Course
- OptionsPro
- Retirement Income Workshop
- Sure-Fire Trading Systems (VectorVest, Inc.)
- Trading as a Business Workshop
- VectorVest 7 EOD
- VectorVest 7 RealTime/IntraDay
- VectorVest AutoTester
- VectorVest Educational Services
- VectorVest OnLine
- VectorVest Options Analyzer
- VectorVest ProGraphics v6.0
- VectorVest ProTrader 7
- VectorVest RealTime Derby Tool
- VectorVest Simulator
- VectorVest Variator
- VectorVest Watchdog
- StockCharts.com, Inc.
- Candle Patterns
- Candlestick Charting Explained
- Intermarket Technical Analysis
- John Murphy on Chart Analysis
- John Murphy's Chart Pattern Recognition
- John Murphy's Market Message
- MurphyExplainsMarketAnalysis-Intermarket Analysis
- MurphyExplainsMarketAnalysis-Visual Analysis
- StockCharts.com
- Technical Analysis of the Financial Markets
- The Visual Investor
