HOT TOPICS LIST
- MACD
- Fibonacci
- RSI
- Gann
- ADXR
- Stochastics
- Volume
- Triangles
- Futures
- Cycles
- Volatility
- ZIGZAG
- MESA
- Retracement
- Aroon
INDICATORS LIST
LIST OF TOPICS
PRINT THIS ARTICLE
by Mike Carr, CMT
Bull markets are usually led higher by stocks in the NASDAQ and small-cap stocks. But not right now.
Position: Sell
Mike Carr, CMT
Mike Carr, CMT, is a member of the Market Technicians Association, and editor of the MTA's newsletter, Technically Speaking. He is also the author of "Smarter Investing in Any Economy: The Definitive Guide to Relative Strength Investing," and "Conquering the Divide: How to Use Economic Indicators to Catch Stock Market Trends."
PRINT THIS ARTICLE
MOMENTUM
Tech And Small Cap Point Toward Lower Stock Market
05/26/11 08:25:34 AMby Mike Carr, CMT
Bull markets are usually led higher by stocks in the NASDAQ and small-cap stocks. But not right now.
Position: Sell
| Great bull markets, like the one we enjoyed in the 1990s, are led by speculative stocks. Tech and small cap are widely acknowledged to be the leaders in a healthy bull market where continued gains are likely. Both sectors are showing momentum divergences now and indicate that the two-year market advance may be stalling. |
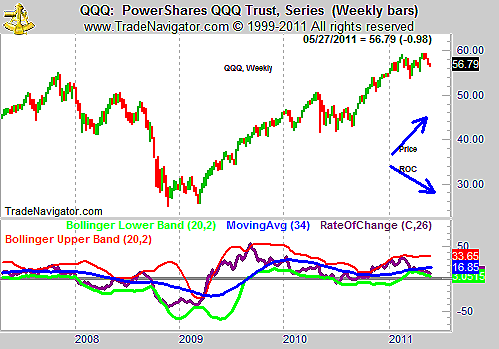
| The NASDAQ 100 (Figure 1) shows a sharp divergence between price and momentum since the beginning of the year. Divergences are not sell signals; they are more like caution flags and need to be evaluated. They could precede a healthy consolidation. However, in this case the divergence seems to be coming after a large up move, and the chart shows that QQQ seems to be rolling over after forming a top. |

|
| FIGURE 1: QQQ, WEEKLY. A momentum divergence is clearly visible on this chart of QQQ. |
| Graphic provided by: Trade Navigator. |
| |
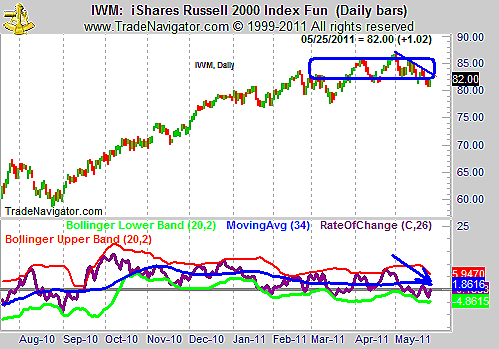
| The Russell 2000, a broad small-cap index, looks just like the NASDAQ 100 (Figure 2). The daily chart is shown instead of the weekly, because the weekly chart of IWM shows the same type of topping formation with a momentum divergence we see in QQQ. We can see that IWM has broken below a support level that served as resistance earlier this year. Over the past month, we also see a series of lower highs and lower lows, which is the most basic definition of a downtrend. |

|
| FIGURE 2: IWM, DAILY. IWM has several bearish factors visible in this chart. |
| Graphic provided by: Trade Navigator. |
| |
| Without leadership from tech or small caps, the stock market is unlikely to see new highs. Markets can consolidate to resolve a divergence, but the charts show that risk may outweigh potential rewards at this point. |
Mike Carr, CMT, is a member of the Market Technicians Association, and editor of the MTA's newsletter, Technically Speaking. He is also the author of "Smarter Investing in Any Economy: The Definitive Guide to Relative Strength Investing," and "Conquering the Divide: How to Use Economic Indicators to Catch Stock Market Trends."
| Website: | www.moneynews.com/blogs/MichaelCarr/id-73 |
| E-mail address: | marketstrategist@gmail.com |
Click here for more information about our publications!
PRINT THIS ARTICLE

Request Information From Our Sponsors
- StockCharts.com, Inc.
- Candle Patterns
- Candlestick Charting Explained
- Intermarket Technical Analysis
- John Murphy on Chart Analysis
- John Murphy's Chart Pattern Recognition
- John Murphy's Market Message
- MurphyExplainsMarketAnalysis-Intermarket Analysis
- MurphyExplainsMarketAnalysis-Visual Analysis
- StockCharts.com
- Technical Analysis of the Financial Markets
- The Visual Investor
- VectorVest, Inc.
- Executive Premier Workshop
- One-Day Options Course
- OptionsPro
- Retirement Income Workshop
- Sure-Fire Trading Systems (VectorVest, Inc.)
- Trading as a Business Workshop
- VectorVest 7 EOD
- VectorVest 7 RealTime/IntraDay
- VectorVest AutoTester
- VectorVest Educational Services
- VectorVest OnLine
- VectorVest Options Analyzer
- VectorVest ProGraphics v6.0
- VectorVest ProTrader 7
- VectorVest RealTime Derby Tool
- VectorVest Simulator
- VectorVest Variator
- VectorVest Watchdog
