HOT TOPICS LIST
- MACD
- Fibonacci
- RSI
- Gann
- ADXR
- Stochastics
- Volume
- Triangles
- Futures
- Cycles
- Volatility
- ZIGZAG
- MESA
- Retracement
- Aroon
INDICATORS LIST
LIST OF TOPICS
PRINT THIS ARTICLE
by Billy Williams
Many investors dismiss technical analysis as reading tea leaves and market voodoo, but using indicators like relative strength show when a stock is about to rise.
Position: Hold
Billy Williams
Billy Williams has been trading the markets for 27 years, specializing in momentum trading with stocks and options.
PRINT THIS ARTICLE
TECHNICAL INDICATORS
Tea Leaves, Voodoo, And Other Technical Tools
05/25/11 08:32:37 AMby Billy Williams
Many investors dismiss technical analysis as reading tea leaves and market voodoo, but using indicators like relative strength show when a stock is about to rise.
Position: Hold
| Among the great debates in the modern age are between the fundamentalist investor and the market technician. The fundamentalist stresses a stock's cash flow, debt ratio, market share, competitive advantage, and the like while the market technician takes a close study of the stock's price action using a variety of technical tools to confirm the direction of the trend. The application of such technical tools are where many fundamentals investors miss the point, dismissing such approaches as little more than reading tea leaves or market voodoo while failing to realize that you cannot have profits without prices moving in your favor. Perhaps one of the most misunderstood technical tools in this regard is relative strength (RS). When a stock is fundamentally healthy and has a number of large institutions, such as multibillion dollar pension funds and/or mutual funds, investing large amounts of capital in accumulating its shares, the stock is gaining strength as each accumulated share acts as fuel to push the stock higher. As it begins to rise, it will begin to outperform other stocks in its peer group and, quite possibly, other sectors of the market as well. |

|
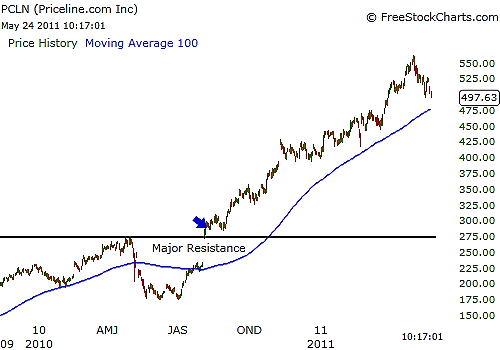
| FIGURE 1: PCLN. PCLN has an overall RS of 95, revealing a high-performing stock that is performing well even in a difficult market. High RS stocks that hold up well in a down market are worth noting because when the overall market turns bullish once more, these stocks typically help lead the rally. |
| Graphic provided by: www.freestockcharts.com. |
| |
| As this phenomenon begins to occur, the RS begins to rise as well; the RS is gauged on a score between zero to 100 and the higher the score, the higher the stock is performing relative to the rest of the overall stock market. See Figure 1. When scanning the universe of stocks to invest or trade in, this is the critical juncture at where market technicians and the fundamentalist/value investor begin to split in their approaches. The value investor, for example, looks at an undervalued company and begins accumulating shares, but the technician who is looking at the low RS of the stock scratches his head at the actions of the value investor because he can't understand why anyone would buy a stock that is not gathering strength and appreciating in value in the present. |
| If a stock is undervalued and you buy it on that basis, only then you may have to wait a long time before you receive any return, if any. This is the equivalent of listening to your brother-in-law give investment advice and stock tips because "it's a really good company." Remember, Enron in its heyday was receiving buy recommendations from the major stock brokerages, even as the stock was plummeting, all on the basis that it was a good value. Relative strength, however, tells you how strong a stock is performing in comparison to other stocks over a defined period of time. More important, keep in mind that the reality of the equity markets is that the strong get stronger and the weak quite often get weaker. |
| That is why out of all the testable technical tools, relative strength has proven to be one of the most robust independent variables when approaching the market for world-class traders like Mark Boucher and William O'Neil. However, as a standalone tool, relative strength can be a cornerstone indicator in any sound trading approach, but to magnify your success, you must use a combination of trend-following, price/volume study, and momentum. By using these tools in the right combination with relative strength as a basis point, you can gain a strong competitive advantage in this trading environment. |
Billy Williams has been trading the markets for 27 years, specializing in momentum trading with stocks and options.
| Company: | StockOptionSystem.com |
| E-mail address: | stockoptionsystem.com@gmail.com |
Traders' Resource Links | |
| StockOptionSystem.com has not added any product or service information to TRADERS' RESOURCE. | |
Click here for more information about our publications!
PRINT THIS ARTICLE

Request Information From Our Sponsors
- StockCharts.com, Inc.
- Candle Patterns
- Candlestick Charting Explained
- Intermarket Technical Analysis
- John Murphy on Chart Analysis
- John Murphy's Chart Pattern Recognition
- John Murphy's Market Message
- MurphyExplainsMarketAnalysis-Intermarket Analysis
- MurphyExplainsMarketAnalysis-Visual Analysis
- StockCharts.com
- Technical Analysis of the Financial Markets
- The Visual Investor
- VectorVest, Inc.
- Executive Premier Workshop
- One-Day Options Course
- OptionsPro
- Retirement Income Workshop
- Sure-Fire Trading Systems (VectorVest, Inc.)
- Trading as a Business Workshop
- VectorVest 7 EOD
- VectorVest 7 RealTime/IntraDay
- VectorVest AutoTester
- VectorVest Educational Services
- VectorVest OnLine
- VectorVest Options Analyzer
- VectorVest ProGraphics v6.0
- VectorVest ProTrader 7
- VectorVest RealTime Derby Tool
- VectorVest Simulator
- VectorVest Variator
- VectorVest Watchdog
