HOT TOPICS LIST
- MACD
- Fibonacci
- RSI
- Gann
- ADXR
- Stochastics
- Volume
- Triangles
- Futures
- Cycles
- Volatility
- ZIGZAG
- MESA
- Retracement
- Aroon
INDICATORS LIST
LIST OF TOPICS
PRINT THIS ARTICLE
by Billy Williams
In the current market, price trades near its annual highs and while it may look like a potential breakout to newer highs, the nagging question is whether the market could be at its breaking point.
Position: Hold
Billy Williams
Billy Williams has been trading the markets for 27 years, specializing in momentum trading with stocks and options.
PRINT THIS ARTICLE
OPTIONS TRADING
Breakouts And Breaking Points
05/23/11 11:04:00 AMby Billy Williams
In the current market, price trades near its annual highs and while it may look like a potential breakout to newer highs, the nagging question is whether the market could be at its breaking point.
Position: Hold
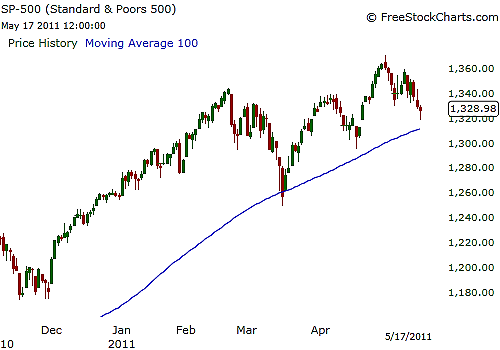
| After climbing back from a mid-March pullback, the Standard & Poor's 500 (SPX) managed to climb back and make a significant price high at the beginning of May but now, the SPX is struggling against historical price patterns and losing ground. According to the "Stock Trader's Almanac," the worst six months of the year begin with May; a $10,000 investment compounded to $527,388 for November to April in 60 years compared to a $474 loss for May to October. Given those kind of historical odds, from here on to October is a time to be cautious on the upside. But by remaining nimble, you can profit on the downside. To play the upside during this historical cycle, you want to be very picky on the stocks you put on your watchlist by selecting fundamentally sound companies that have a combination of sales revenue, profits, low debt, and strong quarter-over-quarter earnings growth. |

|
| FIGURE 1: S&P 500. The "sell in May and go away" cycle began with the S&P pulling back at the beginning of May and setting the stage for a challenging environment for the rest of the year unless you know how to adapt and profit. |
| Graphic provided by: www.freestockcharts.com. |
| |
| In addition, you want to cull your stock watchlist of any stocks that have relative strength (RS) of 85 or lower. RS is a crucial indicator that gives a comparative reading of the performance of an individual stock versus the overall stock market. Scores of zero to 100 are assigned to a stock based on the strength that it shows when compared to the current performance of the general market, and the higher the reading, the stronger the stock is performing in the current trading climate. RS is considered to be the cornerstone of any good stock picking with Mark Boucher, hedge fund manager and author of the book "The Hedge Fund Edge," making the point that stocks with high RS are likely to not only achieve higher than normal returns but are also likely to emerge as new stock leaders to take the market to higher price levels. |
| As you begin to close out May, consider that in the summer months it is common to see trade volume dry up with price action as June approaches with price action becoming almost lackluster, as a result. This phenomenon occurs because traders on the floor of the exchanges typically go on vacation, content to sit out the poor trade participation and also looking to rack up easy income from credit option spreads that take advantage of the lazy back-and-forth trading. This changes the dynamic of the market and makes it fertile ground for using credit option spreads to create income by taking advantage of the lackadaisical back-and-forth trading that occurs as a result. That said, using a 200-day simple moving average (SMA) can help you filter out bullish or bearish spread positions; if the stock is trading above the 200-day SMA, then you want to focus on using bullish option strategies. If the stock is trading below the 200-day SMA, then you want to concentrate on using bearish option strategies. |
| Trading can be a challenge from May onward into the rest of the year, and this is where you must have a combination of sound trading method and experience in order to avoid being whipsawed in the market's price action to remain alert and flexible in your approach to the markets. In the current market, price trades near its annual highs and it may look like a potential breakout to newer highs. However, in the current trade cycle the nagging doubt that hangs in the air is whether the market could stay at its current levels for a while or just break down. |
Billy Williams has been trading the markets for 27 years, specializing in momentum trading with stocks and options.
| Company: | StockOptionSystem.com |
| E-mail address: | stockoptionsystem.com@gmail.com |
Traders' Resource Links | |
| StockOptionSystem.com has not added any product or service information to TRADERS' RESOURCE. | |
Click here for more information about our publications!
Comments

Request Information From Our Sponsors
- StockCharts.com, Inc.
- Candle Patterns
- Candlestick Charting Explained
- Intermarket Technical Analysis
- John Murphy on Chart Analysis
- John Murphy's Chart Pattern Recognition
- John Murphy's Market Message
- MurphyExplainsMarketAnalysis-Intermarket Analysis
- MurphyExplainsMarketAnalysis-Visual Analysis
- StockCharts.com
- Technical Analysis of the Financial Markets
- The Visual Investor
- VectorVest, Inc.
- Executive Premier Workshop
- One-Day Options Course
- OptionsPro
- Retirement Income Workshop
- Sure-Fire Trading Systems (VectorVest, Inc.)
- Trading as a Business Workshop
- VectorVest 7 EOD
- VectorVest 7 RealTime/IntraDay
- VectorVest AutoTester
- VectorVest Educational Services
- VectorVest OnLine
- VectorVest Options Analyzer
- VectorVest ProGraphics v6.0
- VectorVest ProTrader 7
- VectorVest RealTime Derby Tool
- VectorVest Simulator
- VectorVest Variator
- VectorVest Watchdog
