HOT TOPICS LIST
- MACD
- Fibonacci
- RSI
- Gann
- ADXR
- Stochastics
- Volume
- Triangles
- Futures
- Cycles
- Volatility
- ZIGZAG
- MESA
- Retracement
- Aroon
INDICATORS LIST
LIST OF TOPICS
PRINT THIS ARTICLE
by Koos van der Merwe
Below is a trading strategy I learned in the 1980s. Applying it to Annaly can be profitable.
Position: Accumulate
Koos van der Merwe
Has been a technical analyst since 1969, and has worked as a futures and options trader with First Financial Futures in Johannesburg, South Africa.
PRINT THIS ARTICLE
DATA
Playing The Dividend Game
05/23/11 08:23:02 AMby Koos van der Merwe
Below is a trading strategy I learned in the 1980s. Applying it to Annaly can be profitable.
Position: Accumulate
| Annaly Capital Management is a real estate investment trust (REIT) under the Internal Revenue Code and own and manage a portfolio of mortgage-backed securities. Its business objective is to generate income for distributions to our stockholders from the spread between the interest income on its mortgage-backed securities and the costs of borrowing to finance the acquisition of mortgage-backed securities and from dividends it receives from its taxable REIT subsidiaries. Mortgage-backed securities was one of the reasons for the collapse in the US economy where bad mortgages were tied together with good mortgages and sold to the public as a solid investment. To buy into a REIT that specializes in them could be risky, and a look at Figure 1 shows that after the initial rise and then fall along with the market as bubbles burst, the share price has been pretty consistent. With a yield of 13.8%, is it worth holding? |

|
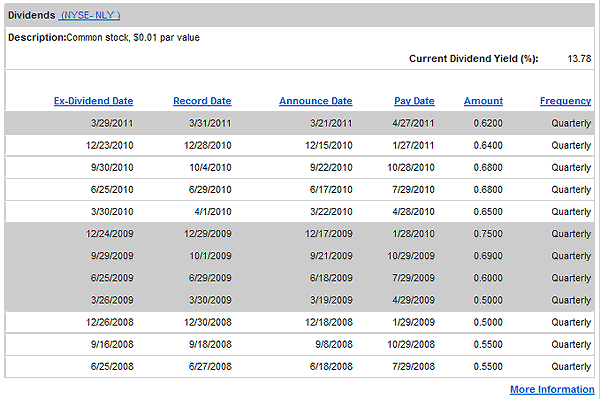
| FIGURE 1: DIVIDEND DATES |
| Graphic provided by: Internet.. |
| |
| Figure 1 shows the quarterly distribution, from June 25, 2008, to March 29, 2011. Note how the amount per share paid has increased from 0.5500 to 0.6200 per quarter. To achieve this they must be doing something right. |

|
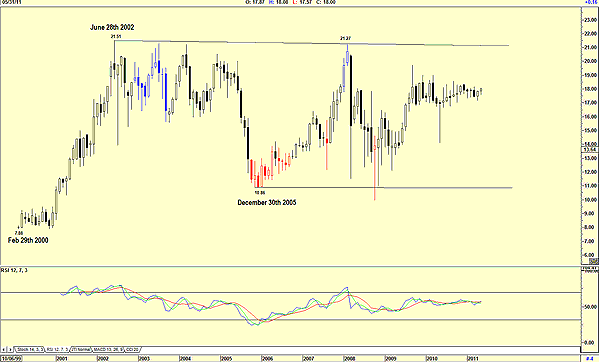
| FIGURE 2: NLY, MONTHLY. Here's the movement of share. |
| Graphic provided by: AdvancedGET. |
| |
| Figure 2, a monthly chart, shows how the share price rose from a low of $7.88 in February 29, 2000, to a high of 21.51 by June 28, 2002. It then dropped to 10.86 by December 30, 2005, and rose to test the upper trendline at $21.27, fell to the lower support line at $10.86, and since then has been trading in the $17 to $19 range. As shown, the current yield is 13.78%, a very comfortable figure. What are the risks? The risk, of course, is the movement of the share price, giving you a capital loss. Figure 3, the daily chart, tells you how to play this movement. |

|
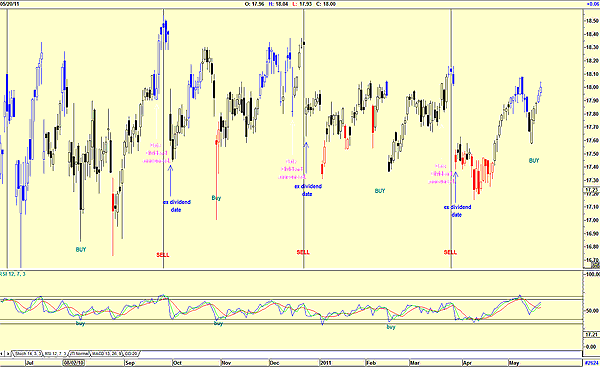
| FIGURE 2: NLY, DAILY. Here's movement. |
| Graphic provided by: AdvancedGET. |
| |
| A look at Figure 3 shows you the date the dividend was announced, the ex-dividend date and a high price a few days before the ex-dividend date. I have marked this as a sell. The strategy to play this share then works as follows: a. Sometime between the ex-dividend dates, we would buy the share based on a buy signal given by the relative strength index (RSI). Those traders who are a bit more adventurous could buy the share soon after the ex-dividend date, should the RSI give a buy signal. b. We would then hold the share and sell it three days after the dividend is announced. The chart shows that we should always enjoy a pleasant capital growth. Of course, there is always the risk that the company could default on a dividend payment, but that is the risk we take generally with dividend or interest-paying shares. The other risk, of course, is emotion. We must be entirely emotionless when trading this way. This is the system -- stick to it. |
Has been a technical analyst since 1969, and has worked as a futures and options trader with First Financial Futures in Johannesburg, South Africa.
| Address: | 3256 West 24th Ave |
| Vancouver, BC | |
| Phone # for sales: | 6042634214 |
| E-mail address: | petroosp@gmail.com |
Click here for more information about our publications!
PRINT THIS ARTICLE

Request Information From Our Sponsors
- StockCharts.com, Inc.
- Candle Patterns
- Candlestick Charting Explained
- Intermarket Technical Analysis
- John Murphy on Chart Analysis
- John Murphy's Chart Pattern Recognition
- John Murphy's Market Message
- MurphyExplainsMarketAnalysis-Intermarket Analysis
- MurphyExplainsMarketAnalysis-Visual Analysis
- StockCharts.com
- Technical Analysis of the Financial Markets
- The Visual Investor
- VectorVest, Inc.
- Executive Premier Workshop
- One-Day Options Course
- OptionsPro
- Retirement Income Workshop
- Sure-Fire Trading Systems (VectorVest, Inc.)
- Trading as a Business Workshop
- VectorVest 7 EOD
- VectorVest 7 RealTime/IntraDay
- VectorVest AutoTester
- VectorVest Educational Services
- VectorVest OnLine
- VectorVest Options Analyzer
- VectorVest ProGraphics v6.0
- VectorVest ProTrader 7
- VectorVest RealTime Derby Tool
- VectorVest Simulator
- VectorVest Variator
- VectorVest Watchdog
