HOT TOPICS LIST
- MACD
- Fibonacci
- RSI
- Gann
- ADXR
- Stochastics
- Volume
- Triangles
- Futures
- Cycles
- Volatility
- ZIGZAG
- MESA
- Retracement
- Aroon
INDICATORS LIST
LIST OF TOPICS
PRINT THIS ARTICLE
by Koos van der Merwe
The market is falling. You can either go to cash and earn a low interest, or you can look for a stable share that pays a reasonable interest.
Position: Buy
Koos van der Merwe
Has been a technical analyst since 1969, and has worked as a futures and options trader with First Financial Futures in Johannesburg, South Africa.
PRINT THIS ARTICLE
VOLATILITY
When The Market Falls, Look For Income
05/19/11 08:27:20 AMby Koos van der Merwe
The market is falling. You can either go to cash and earn a low interest, or you can look for a stable share that pays a reasonable interest.
Position: Buy
| There are many stocks out there that give a decent yield, either as a dividend or as interest. The only problem is, if the market is falling, so will they, giving you a capital loss that hurts. The answer is to find a share that not only gives a good yield but also has a low volatility, so that the paper loss will not be that great. You will also know that as the market recovers, so will the share price. Are there shares like this out there? Yes, quite a few. You just has to look for them. Exchange Income Corp. listed on the Toronto stock market is one of them. At the current price of C$23.15, the yield is 6.7%. Not bad. The company was created to invest in profitable, well-established companies with strong cash flows operating in niche markets in Canada and/or the US and to distribute stable monthly cash dividends to its shareholders. |

|
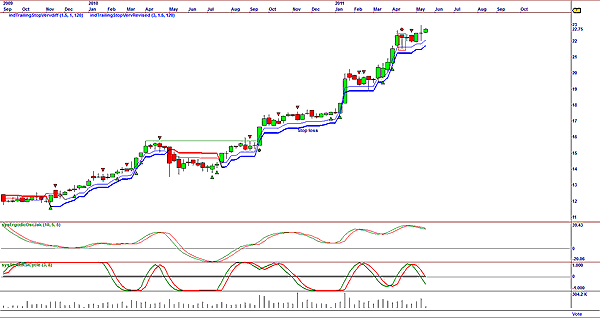
| FIGURE 1: EXCHANGE INCOME FUND, WEEKLY |
| Graphic provided by: OmniTrader. |
| |
| Figure 1 is a weekly chart and shows you how the price has moved from a low of $12 in 2009 to its present high of $22.75. The two indicators on the chart, the ergodic oscillator and stochastic RSI cycle, are both suggesting weakness, with an opportunity to buy. |

|
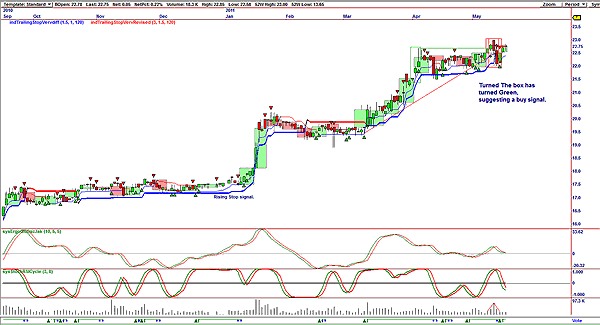
| FIGURE 2: EXCHANGE INCOME FUND, DAILY |
| Graphic provided by: OmniTrader. |
| |
| Figure 2, a daily chart, shows that the vote line, a consolidation of the various strategies I use to finalize a decision, has given a new buy signal. The chart shows the following: 1. The box around the candlesticks has turned green, suggesting a buy signal. 2. The price is testing the rising stop signal. 3. The ergodic oscillator has given a buy. 4. The stochastic RSI cycle indicator is close to giving a buy signal. I would be a buyer of the Exchange Income fund at current prices, with a hold for the long term. |
Has been a technical analyst since 1969, and has worked as a futures and options trader with First Financial Futures in Johannesburg, South Africa.
| Address: | 3256 West 24th Ave |
| Vancouver, BC | |
| Phone # for sales: | 6042634214 |
| E-mail address: | petroosp@gmail.com |
Click here for more information about our publications!
PRINT THIS ARTICLE

Request Information From Our Sponsors
- StockCharts.com, Inc.
- Candle Patterns
- Candlestick Charting Explained
- Intermarket Technical Analysis
- John Murphy on Chart Analysis
- John Murphy's Chart Pattern Recognition
- John Murphy's Market Message
- MurphyExplainsMarketAnalysis-Intermarket Analysis
- MurphyExplainsMarketAnalysis-Visual Analysis
- StockCharts.com
- Technical Analysis of the Financial Markets
- The Visual Investor
- VectorVest, Inc.
- Executive Premier Workshop
- One-Day Options Course
- OptionsPro
- Retirement Income Workshop
- Sure-Fire Trading Systems (VectorVest, Inc.)
- Trading as a Business Workshop
- VectorVest 7 EOD
- VectorVest 7 RealTime/IntraDay
- VectorVest AutoTester
- VectorVest Educational Services
- VectorVest OnLine
- VectorVest Options Analyzer
- VectorVest ProGraphics v6.0
- VectorVest ProTrader 7
- VectorVest RealTime Derby Tool
- VectorVest Simulator
- VectorVest Variator
- VectorVest Watchdog
