HOT TOPICS LIST
- MACD
- Fibonacci
- RSI
- Gann
- ADXR
- Stochastics
- Volume
- Triangles
- Futures
- Cycles
- Volatility
- ZIGZAG
- MESA
- Retracement
- Aroon
INDICATORS LIST
LIST OF TOPICS
PRINT THIS ARTICLE
by Donald W. Pendergast, Jr.
Yahoo shares had been chopping sideways in a six-month, $3-wide consolidation zone, but the recent decline in the stock now has all the makings of a significant trend reversal.
Position: Sell
Donald W. Pendergast, Jr.
Donald W. Pendergast is a financial markets consultant who offers specialized services to stock brokers and high net worth individuals who seek a better bottom line for their portfolios.
PRINT THIS ARTICLE
SUPPORT & RESISTANCE
YHOO Shock Selloff May Initiate Further Declines
05/18/11 10:01:51 AMby Donald W. Pendergast, Jr.
Yahoo shares had been chopping sideways in a six-month, $3-wide consolidation zone, but the recent decline in the stock now has all the makings of a significant trend reversal.
Position: Sell
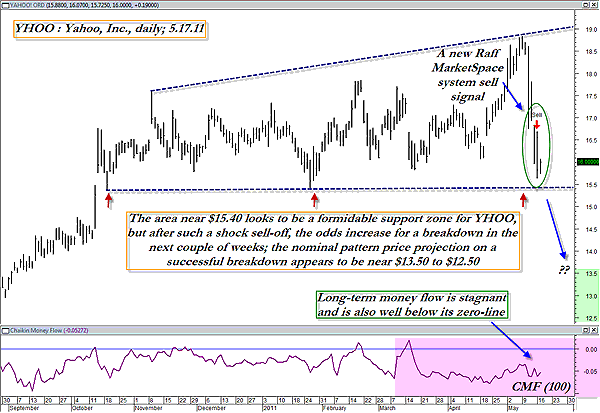
| Consolidation patterns are tough for trend-followers, even as they remain a bread & butter staple for the oscillator crowd -- the traders who rely on Bollinger bands, relative strength index (RSI), and commodity channel index (CCI) (among others) indicators to help spot short-term overbought/oversold levels in a stock or futures contract. As long as the tradable can make fairly smooth oscillations with enough room to rise or fall to make putting on a trade worthwhile, these traders stand to make some pretty good money for as long as such range-bound market conditions exist. From the looks of this daily graph of Yahoo (YHOO) shares, there were at least 10 to 12 such opportunities to make money this way during the November to May trading range (Figure 1). Trend-followers, on the other hand, would have been tearing out their hair as they experienced stop-out after stop-out on trades that failed to gain enough traction to make a decent trending move. But now the tide appears to have turned and trend-followers might want to pay attention to the new Raff MarketSpace system sell signal on the daily chart. Here's a closer look. |

|
| FIGURE 1: YHOO, DAILY. Plenty of eyes will be looking at the $15.40-15.50 support zone in YHOO during the next week or so; all of the ingredients necessary for a big decline appear to be in place. |
| Graphic provided by: MetaStock. |
| Graphic provided by: Gil Raff expert advisor from MetaStock 11. |
| |
| Similar to my chart of NVDA yesterday ("NVDA Leading The Charge Lower," May 17), we also see a very pronounced, relatively flat area of major support just below the current price of the stock in Figure 1. And, interestingly enough, YHOO's chart also features a broadening pattern, one that also lends itself to projection of price targets. Both YHOO and NVDA have staged sharp selloffs in the last week or so and have also issued sell signals from very good trading systems -- in YHOO's case, it's the Raff sell signal. Meanwhile, if you glance at the bottom of the chart, you'll see that the long-term money flow (the Chaikin money flow (CMF)(100)) is in negative territory and has been so for the better part of the last 11 months. All told, this looks like a reasonably solid short trade setup, as long as the supports at $15.63 and then $15.37 are violated on high volume. Traders can opt to go for a short-term long put option play -- a June $16 YHOO put is going for about $0.75, and if YHOO can drop to $14.58 per share by June 1, 2011, a trader would stand to make nearly 100% on the original purchase price of the option. Meanwhile, if YHOO rises to $16.70 (the most logical place to set the initial stop), the trader would instead lose about $50. The big idea with long option positions is to take profits on the first statistically meaningful swing and get out of the position before time decay and implied volatility declines can do too much damage to the value of the option. Bid-ask spreads are very small on most YHOO options, and volume/open interest is more than sufficient to help make putting on and taking off trades as trouble-free as possible. Take some time and work with all of the option trading tools in Thinkorswim (or Interactive Brokers, TradeStation, and so on) and see if you don't agree that this current short setup in YHOO might be a good one to utilize a long put option on. It could be a worthwhile endeavor. |
Donald W. Pendergast is a financial markets consultant who offers specialized services to stock brokers and high net worth individuals who seek a better bottom line for their portfolios.
| Title: | Writer, market consultant |
| Company: | Linear Trading Systems LLC |
| Jacksonville, FL 32217 | |
| Phone # for sales: | 904-239-9564 |
| E-mail address: | lineartradingsys@gmail.com |
Traders' Resource Links | |
| Linear Trading Systems LLC has not added any product or service information to TRADERS' RESOURCE. | |
Click here for more information about our publications!
PRINT THIS ARTICLE

Request Information From Our Sponsors
- StockCharts.com, Inc.
- Candle Patterns
- Candlestick Charting Explained
- Intermarket Technical Analysis
- John Murphy on Chart Analysis
- John Murphy's Chart Pattern Recognition
- John Murphy's Market Message
- MurphyExplainsMarketAnalysis-Intermarket Analysis
- MurphyExplainsMarketAnalysis-Visual Analysis
- StockCharts.com
- Technical Analysis of the Financial Markets
- The Visual Investor
- VectorVest, Inc.
- Executive Premier Workshop
- One-Day Options Course
- OptionsPro
- Retirement Income Workshop
- Sure-Fire Trading Systems (VectorVest, Inc.)
- Trading as a Business Workshop
- VectorVest 7 EOD
- VectorVest 7 RealTime/IntraDay
- VectorVest AutoTester
- VectorVest Educational Services
- VectorVest OnLine
- VectorVest Options Analyzer
- VectorVest ProGraphics v6.0
- VectorVest ProTrader 7
- VectorVest RealTime Derby Tool
- VectorVest Simulator
- VectorVest Variator
- VectorVest Watchdog
