HOT TOPICS LIST
- MACD
- Fibonacci
- RSI
- Gann
- ADXR
- Stochastics
- Volume
- Triangles
- Futures
- Cycles
- Volatility
- ZIGZAG
- MESA
- Retracement
- Aroon
INDICATORS LIST
LIST OF TOPICS
PRINT THIS ARTICLE
by David Penn
Does June gold's retreat from its January highs mean the end of the yellow metal's bull market?
Position: N/A
David Penn
Technical Writer for Technical Analysis of STOCKS & COMMODITIES magazine, Working-Money.com, and Traders.com Advantage.
PRINT THIS ARTICLE
TECHNICAL ANALYSIS
Goodbye, Gold?
03/21/02 12:02:43 PMby David Penn
Does June gold's retreat from its January highs mean the end of the yellow metal's bull market?
Position: N/A
| About a month ago I noted that both the U.S. dollar (the "greenback") and the continuous gold futures contract were both holding at significant support ("Supporting Gold and the Greenback," February 21, 2002. Traders.com Advantage). What was particularly curious about both the greenback and gold at the time was the fact that both had rallied into 2002--unusual for assets that tend to move inversely to one another. As such it seemed likely that when one finally moved away from support--either by breaking down beneath it or by rising up and away from it--the other would move in the opposite direction. Thus, the greenback and gold became part of a waiting game that was made tolerable by the assurance that whatever one did would provide insight into what the other was about to do. |
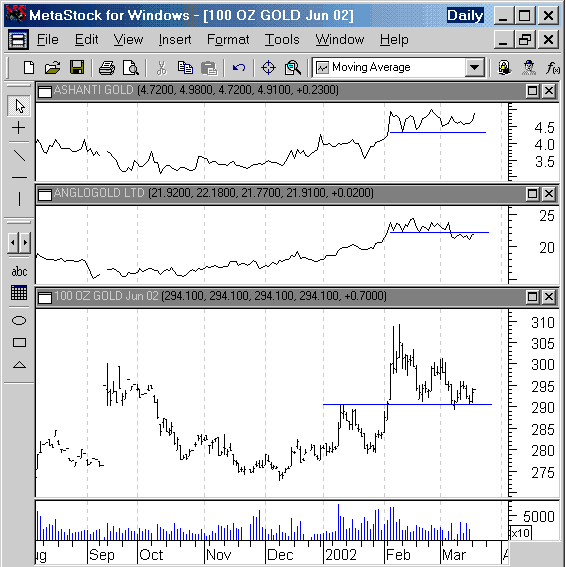
| Unfortunately, that waiting game has gone into extra innings. Gold, as measured by the June gold futures contract, has held at the support level of 291 now for two months--even as June gold has registered consistently lower rally highs in January (309), February (303), and March-to-date (296). The greenback, for its part, has fallen through the support level (118) mentioned a month ago. This would be good, generally speaking, for gold. While a sustained breakdown is possible in the greenback, there are a number of potential support areas (116.5, 115.5, 114.5) formed as part of previous correction lows that could halt a greenback decline. This makes it hard to consider the declines in the greenback--even the possible declines just mentioned--as support for a bullish case for gold. |

|
| Shares in gold mining companies offer few clues as to the likelihood of gold going forward. |
| Graphic provided by: MetaStock. |
| |
| Another place to look for gold signals are in gold shares, gold mining companies such as Anglogold Ltd. (AU) and Newmont Mining Corporation (NEM)--as well as others. Gold shares tend to lead the gold price. These companies can be used to help determine the likely direction of gold. It should be added that this gold-shares-leading-gold-price relationship is not permanent and unchanging. John Murphy notes in his "Intermarket Technical Analysis" that gold actually led gold shares at least twice during the 1980s. But the two--gold and gold shares--do move together; regardless of which is showing the greater leadership, convergences are the norm and divergences are cause for concern. |
| Gold shares reflect the indecision that appears in the gold futures. Newmont Mining advanced strongly in January, only to enter a trading range in February and March. Anglogold Ltd. also had a bullish start to the year, but bogged down in February and actually began slipping in March. Other gold shares in companies such as Placer Dome (PDG), Barrick Gold (ABX), and AngloAmerican PLC (AAUK) show similar February/March trading ranges. The only gold share with a real bullish overone is Ashanti Goldfields (ASL) which is testing its year-to-date high in mid-March. |
| Thus, the gold outlook is less than spectacular--offering very little to both bulls and bears at this time. In some ways, that in and of itself is slightly bearish for gold, which appears to be stalling out after powerful, across-the-board bullish advances in gold from the fall of 2001 to January 2002. But perhaps the most significant message is that none of the near-term moves in gold or gold shares should be taken too seriously. Until new highs are set or old support levels tested and broken through, gold seems content to go nowhere. |
Technical Writer for Technical Analysis of STOCKS & COMMODITIES magazine, Working-Money.com, and Traders.com Advantage.
| Title: | Technical Writer |
| Company: | Technical Analysis, Inc. |
| Address: | 4757 California Avenue SW |
| Seattle, WA 98116 | |
| Phone # for sales: | 206 938 0570 |
| Fax: | 206 938 1307 |
| Website: | www.Traders.com |
| E-mail address: | DPenn@traders.com |
Traders' Resource Links | |
| Charting the Stock Market: The Wyckoff Method -- Books | |
| Working-Money.com -- Online Trading Services | |
| Traders.com Advantage -- Online Trading Services | |
| Technical Analysis of Stocks & Commodities -- Publications and Newsletters | |
| Working Money, at Working-Money.com -- Publications and Newsletters | |
| Traders.com Advantage -- Publications and Newsletters | |
| Professional Traders Starter Kit -- Software | |
Click here for more information about our publications!
PRINT THIS ARTICLE

Request Information From Our Sponsors
- StockCharts.com, Inc.
- Candle Patterns
- Candlestick Charting Explained
- Intermarket Technical Analysis
- John Murphy on Chart Analysis
- John Murphy's Chart Pattern Recognition
- John Murphy's Market Message
- MurphyExplainsMarketAnalysis-Intermarket Analysis
- MurphyExplainsMarketAnalysis-Visual Analysis
- StockCharts.com
- Technical Analysis of the Financial Markets
- The Visual Investor
- VectorVest, Inc.
- Executive Premier Workshop
- One-Day Options Course
- OptionsPro
- Retirement Income Workshop
- Sure-Fire Trading Systems (VectorVest, Inc.)
- Trading as a Business Workshop
- VectorVest 7 EOD
- VectorVest 7 RealTime/IntraDay
- VectorVest AutoTester
- VectorVest Educational Services
- VectorVest OnLine
- VectorVest Options Analyzer
- VectorVest ProGraphics v6.0
- VectorVest ProTrader 7
- VectorVest RealTime Derby Tool
- VectorVest Simulator
- VectorVest Variator
- VectorVest Watchdog
