HOT TOPICS LIST
- MACD
- Fibonacci
- RSI
- Gann
- ADXR
- Stochastics
- Volume
- Triangles
- Futures
- Cycles
- Volatility
- ZIGZAG
- MESA
- Retracement
- Aroon
INDICATORS LIST
LIST OF TOPICS
PRINT THIS ARTICLE
by Donald W. Pendergast, Jr.
After making an astounding run higher in late 2010 and early 2011, shares of Nividia Corp. appear to be homing in on a vitally important support area.
Position: Sell
Donald W. Pendergast, Jr.
Donald W. Pendergast is a financial markets consultant who offers specialized services to stock brokers and high net worth individuals who seek a better bottom line for their portfolios.
PRINT THIS ARTICLE
SUPPORT & RESISTANCE
NVDA Leading The Charge Lower?
05/17/11 07:36:01 AMby Donald W. Pendergast, Jr.
After making an astounding run higher in late 2010 and early 2011, shares of Nividia Corp. appear to be homing in on a vitally important support area.
Position: Sell
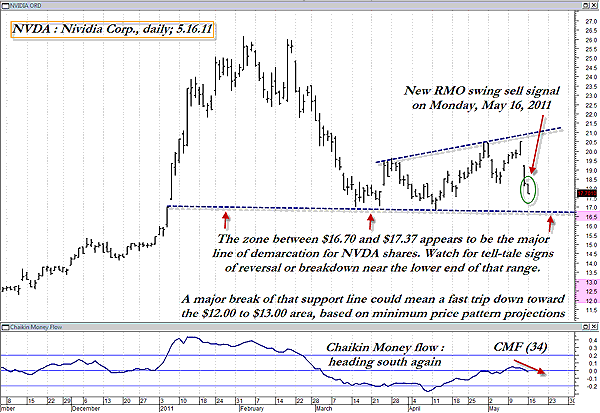
| The tech sector stocks were among the most favored and sought after during 2010 and into 2011, but now that the sector has lost some of its luster, those who were former tech bulls are now learning to play defense instead, trying to protect themselves from further losses. Here's a look at the very interesting chart pattern on the daily graph for Nividia Corp. (NVDA), one that a lot of traders and investors are sure to be watching in the days and weeks just ahead. See Figure 1. |

|
| FIGURE 1: NVDA, DAILY. Trading price patterns can be frustrating, but if you watch the money flow situation and keep abreast of new trading signals from a proven system, the odds for trading success should be greatly enhanced. |
| Graphic provided by: MetaStock. |
| Graphic provided by: Rahul Mohindar oscillator (RMO) from MetaStock 11. |
| |
| Of all of the Standard & Poor's 500 stocks issuing Rahul Mohindar oscillator (RMO) swing sell signals today, Nividia Corp. (NVDA) has the weakest 13-week comparative relative strength ranking versus the .SPX, and from the looks of its very telling chart pattern, this stock appears to be a reasonably sure bet to test its major support line near $16.75 within the next few trading sessions. Intermediate-term money flow is weakening and has also crossed into negative territory again (below its zero line), even as the selloff in the stock appears to be gaining momentum. Traders may have more than a few ways to play this unfolding breakdown: 1. Look to time an intraday pullback up toward $18.00-18.25 before shorting again, using the technical trading trigger of your choosing. You need to have at least a 2-to-1 risk/reward ratio if possible for such a setup and you should also plan on exiting by the end of the day if you go this route. 2. Buy an at-the-money put option and try to hold on for a quick ride south toward that support line near $16.75, closing the trade out immediately near that price zone. 3. The most straightforward choice is to short on a break below Monday's low at $17.70, perhaps running a two- to three-bar trailing stop of the daily lows as you hope for a major trend move to materialize. If a big selloff commences, the width of the broadening formation on the chart suggests that a measured move down toward the $12 to $13 area is a real possibility, so you could also investigate the feasibility of setting a nominal price target somewhere in that vicinity. The choice is all yours, of course. You'll also need to size your positions properly, making sure you don't risk too much of your account's equity on the trade, for only in that way can you consistently begin to put the odds for trading success more firmly in your favor. |
Donald W. Pendergast is a financial markets consultant who offers specialized services to stock brokers and high net worth individuals who seek a better bottom line for their portfolios.
| Title: | Writer, market consultant |
| Company: | Linear Trading Systems LLC |
| Jacksonville, FL 32217 | |
| Phone # for sales: | 904-239-9564 |
| E-mail address: | lineartradingsys@gmail.com |
Traders' Resource Links | |
| Linear Trading Systems LLC has not added any product or service information to TRADERS' RESOURCE. | |
Click here for more information about our publications!
PRINT THIS ARTICLE

Request Information From Our Sponsors
- StockCharts.com, Inc.
- Candle Patterns
- Candlestick Charting Explained
- Intermarket Technical Analysis
- John Murphy on Chart Analysis
- John Murphy's Chart Pattern Recognition
- John Murphy's Market Message
- MurphyExplainsMarketAnalysis-Intermarket Analysis
- MurphyExplainsMarketAnalysis-Visual Analysis
- StockCharts.com
- Technical Analysis of the Financial Markets
- The Visual Investor
- VectorVest, Inc.
- Executive Premier Workshop
- One-Day Options Course
- OptionsPro
- Retirement Income Workshop
- Sure-Fire Trading Systems (VectorVest, Inc.)
- Trading as a Business Workshop
- VectorVest 7 EOD
- VectorVest 7 RealTime/IntraDay
- VectorVest AutoTester
- VectorVest Educational Services
- VectorVest OnLine
- VectorVest Options Analyzer
- VectorVest ProGraphics v6.0
- VectorVest ProTrader 7
- VectorVest RealTime Derby Tool
- VectorVest Simulator
- VectorVest Variator
- VectorVest Watchdog
