HOT TOPICS LIST
- MACD
- Fibonacci
- RSI
- Gann
- ADXR
- Stochastics
- Volume
- Triangles
- Futures
- Cycles
- Volatility
- ZIGZAG
- MESA
- Retracement
- Aroon
INDICATORS LIST
LIST OF TOPICS
PRINT THIS ARTICLE
by Mike Carr, CMT
Multiple time frame analysis points to lower stock prices.
Position: Sell
Mike Carr, CMT
Mike Carr, CMT, is a member of the Market Technicians Association, and editor of the MTA's newsletter, Technically Speaking. He is also the author of "Smarter Investing in Any Economy: The Definitive Guide to Relative Strength Investing," and "Conquering the Divide: How to Use Economic Indicators to Catch Stock Market Trends."
PRINT THIS ARTICLE
RATE CHANGE - PRICE
S&P 500 Momentum Is Bearish
05/17/11 07:29:14 AMby Mike Carr, CMT
Multiple time frame analysis points to lower stock prices.
Position: Sell
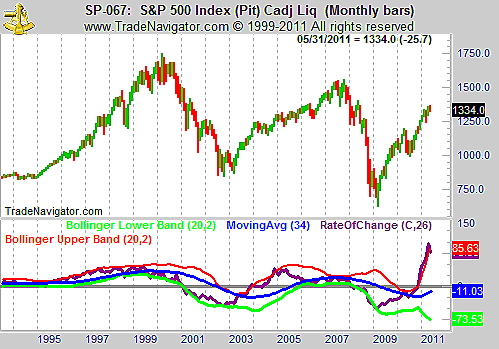
| Monthly charts, like the one of the Standard & Poor's 500 that we see in Figure 1, can offer powerful symbols. Bollinger bands are combined with the rate of change (ROC) momentum indicator. ROC became overbought; it rose above the upper band in late 2004. The market advance stalled at that point. The next buy signal from that indicator occurred at the end of March 2009, a timely buy shown when the ROC crossed above the lower Bollinger band. The sell signal will be confirmed at the end of May, if ROC remains below the upper band. |

|
| FIGURE 1: S&P 500, MONTHLY. ROC has fallen below the upper Bollinger band, a possible signal that the overbought condition is nearing an end. |
| Graphic provided by: Trade Navigator. |
| |
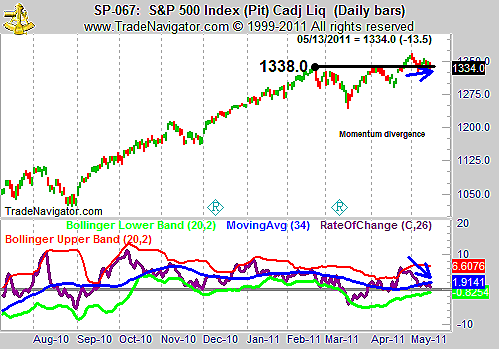
| Long-term trends can be identified with monthly charts. Shorter-term time frames allow traders to confirm the signals and take timely action. For the S&P 500, the daily picture, shown in Figure 2, can also be considered bearish. |

|
| FIGURE 2: S&P 500, DAILY. The S&P 500 stalled at resistance and displays a momentum divergence. |
| Graphic provided by: Trade Navigator. |
| |
| In this chart, ROC failed to confirm the most recent high in the S&P 500. The February high near 1338 proved to be resistance and prices were again struggling at that level. |
| Technical analysis requires the analyst to develop a market opinion based upon the preponderance of the evidence. Stocks right now offer several bearish indicators, and that is worth noting in any analysis. If we see follow-through to the downside, we are likely to face a significant decline. At this point, traders should consider avoiding new long positions until we break decisively higher. Shorts may be early, but they are more likely to see long-term rewards. |
Mike Carr, CMT, is a member of the Market Technicians Association, and editor of the MTA's newsletter, Technically Speaking. He is also the author of "Smarter Investing in Any Economy: The Definitive Guide to Relative Strength Investing," and "Conquering the Divide: How to Use Economic Indicators to Catch Stock Market Trends."
| Website: | www.moneynews.com/blogs/MichaelCarr/id-73 |
| E-mail address: | marketstrategist@gmail.com |
Click here for more information about our publications!
Comments

Request Information From Our Sponsors
- StockCharts.com, Inc.
- Candle Patterns
- Candlestick Charting Explained
- Intermarket Technical Analysis
- John Murphy on Chart Analysis
- John Murphy's Chart Pattern Recognition
- John Murphy's Market Message
- MurphyExplainsMarketAnalysis-Intermarket Analysis
- MurphyExplainsMarketAnalysis-Visual Analysis
- StockCharts.com
- Technical Analysis of the Financial Markets
- The Visual Investor
- VectorVest, Inc.
- Executive Premier Workshop
- One-Day Options Course
- OptionsPro
- Retirement Income Workshop
- Sure-Fire Trading Systems (VectorVest, Inc.)
- Trading as a Business Workshop
- VectorVest 7 EOD
- VectorVest 7 RealTime/IntraDay
- VectorVest AutoTester
- VectorVest Educational Services
- VectorVest OnLine
- VectorVest Options Analyzer
- VectorVest ProGraphics v6.0
- VectorVest ProTrader 7
- VectorVest RealTime Derby Tool
- VectorVest Simulator
- VectorVest Variator
- VectorVest Watchdog
