HOT TOPICS LIST
- MACD
- Fibonacci
- RSI
- Gann
- ADXR
- Stochastics
- Volume
- Triangles
- Futures
- Cycles
- Volatility
- ZIGZAG
- MESA
- Retracement
- Aroon
INDICATORS LIST
LIST OF TOPICS
PRINT THIS ARTICLE
by Matt Blackman
What if there was a stock that provided a reliable warning of a bubble about to break?
Position: N/A
Matt Blackman
Matt Blackman is a full-time technical and financial writer and trader. He produces corporate and financial newsletters, and assists clients in getting published in the mainstream media. He is the host of TradeSystemGuru.com. Matt has earned the Chartered Market Technician (CMT) designation. Find out what stocks and futures Matt is watching on Twitter at www.twitter.com/RatioTrade
PRINT THIS ARTICLE
BULL/BEAR MARKET
Is Sotheby's A Bubble Proxy?
05/13/11 08:14:54 AMby Matt Blackman
What if there was a stock that provided a reliable warning of a bubble about to break?
Position: N/A
| In his 2011 book, "Boom, Bustology: Spotting Financial Bubbles Before They Bust," Vikram Mansharamani examines the history and anatomy of bubbles and busts in financial markets from "Tulipomania" in the early 1600s up to the banking crisis of 2007-08. Like previous books on the subject such as "Manias, Panics And Crashes" by Charles Kindleberger and more recently, "This Time Is Different" by Kenneth Rogoff and Carmen Reinhart, the book is worth the read if only to remind the reader that an understanding of history is essential in preparing for the future. |
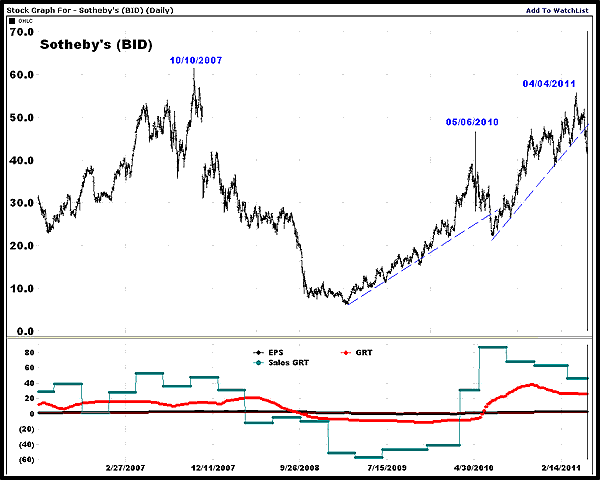
| But "Boom, Bustology" also discusses an interesting indicator of art bubbles -- the stock of auction house Sotheby's (BID). Since art bubbles often occur in conjunction with financial bubbles, it was an interesting revelation. Has BID proven to be a useful market telltale? See Figure 1. |

|
| FIGURE 1: BID, DAILY. Sotheby’s showed the previous peak on October 10, 2007, and two subsequent peaks along with earnings per share (EPS), sales growth rate (Sales GRT), and earnings growth (GRT). |
| Graphic provided by: Chart courtesy of www.VectorVest.com. |
| |
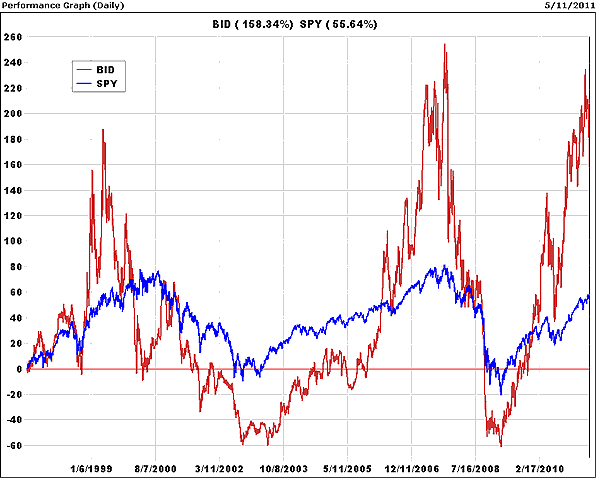
| As we see in Figure 2, BID has acted like the hyperactive smaller brother of the Standard & Poor's 500 (as represented by SPY) to market conditions. As the chart shows, BID peaked on April 16, 1999, nearly one year before SPY, and began to look toppy again in July 2007 before getting its second wind and peaking on October 10, 2007. Just three weeks later, its stock price had been nearly cut in half. For anyone who doubted that the rally was nearing an end, this was one more smoking gun. |
| Sotheby's earns its income through auction commissions, and the more expensive the art sold at auction, the higher its earnings. It is no coincidence that there is more money to throw at expensive art when markets are in the stratosphere, as occurred in 1999 and 2007. Right now? The Sotheby's auction on May 11, 2011, was somewhat of a disappointment to those in the know. Jeff Koons's famous "Pink Panther" sculpture, expected to fetch $30 million, "only" went for $16.9 million. Andy Warhol's "Sixteen Jackies" also disappointed in selling for "just" $20.24 million. |

|
| FIGURE 2: COMPARISON OF BID AND SPY. Daily performance graph comparing BID and SPY over the last dozen years. |
| Graphic provided by: Chart courtesy of www.VectorVest.com. |
| |
| But maybe they were having a bad day because the Christie's auction the following day exceeded expectations, with 62 of 65 lots selling for a cool $301.7 million. Andy Warhol's 1963-64 self-portrait went for an incredible $38.45 million, beating the previous record of $32.56 million for another Warhol self-portrait in May 2010. So are we on the far side of another bubble? I will be examining this question in more detail and exploring Sotheby's and its history as an art and financial market telltale in an upcoming Working Money article. |
Matt Blackman is a full-time technical and financial writer and trader. He produces corporate and financial newsletters, and assists clients in getting published in the mainstream media. He is the host of TradeSystemGuru.com. Matt has earned the Chartered Market Technician (CMT) designation. Find out what stocks and futures Matt is watching on Twitter at www.twitter.com/RatioTrade
| Company: | TradeSystemGuru.com |
| Address: | Box 2589 |
| Garibaldi Highlands, BC Canada | |
| Phone # for sales: | 604-898-9069 |
| Fax: | 604-898-9069 |
| Website: | www.tradesystemguru.com |
| E-mail address: | indextradermb@gmail.com |
Traders' Resource Links | |
| TradeSystemGuru.com has not added any product or service information to TRADERS' RESOURCE. | |
Click here for more information about our publications!
Comments

Request Information From Our Sponsors
- StockCharts.com, Inc.
- Candle Patterns
- Candlestick Charting Explained
- Intermarket Technical Analysis
- John Murphy on Chart Analysis
- John Murphy's Chart Pattern Recognition
- John Murphy's Market Message
- MurphyExplainsMarketAnalysis-Intermarket Analysis
- MurphyExplainsMarketAnalysis-Visual Analysis
- StockCharts.com
- Technical Analysis of the Financial Markets
- The Visual Investor
- VectorVest, Inc.
- Executive Premier Workshop
- One-Day Options Course
- OptionsPro
- Retirement Income Workshop
- Sure-Fire Trading Systems (VectorVest, Inc.)
- Trading as a Business Workshop
- VectorVest 7 EOD
- VectorVest 7 RealTime/IntraDay
- VectorVest AutoTester
- VectorVest Educational Services
- VectorVest OnLine
- VectorVest Options Analyzer
- VectorVest ProGraphics v6.0
- VectorVest ProTrader 7
- VectorVest RealTime Derby Tool
- VectorVest Simulator
- VectorVest Variator
- VectorVest Watchdog
