HOT TOPICS LIST
- MACD
- Fibonacci
- RSI
- Gann
- ADXR
- Stochastics
- Volume
- Triangles
- Futures
- Cycles
- Volatility
- ZIGZAG
- MESA
- Retracement
- Aroon
INDICATORS LIST
LIST OF TOPICS
PRINT THIS ARTICLE
by Mike Carr, CMT
Testing inspired by silver's big plunge last week showed that futures are just as likely to drop further as they are to rebound after a crash. Testing in the stock market finds buying big drops works best in bear markets.
Position: N/A
Mike Carr, CMT
Mike Carr, CMT, is a member of the Market Technicians Association, and editor of the MTA's newsletter, Technically Speaking. He is also the author of "Smarter Investing in Any Economy: The Definitive Guide to Relative Strength Investing," and "Conquering the Divide: How to Use Economic Indicators to Catch Stock Market Trends."
PRINT THIS ARTICLE
STRATEGIES
Big Stock Drops. What Happens Next?
05/11/11 01:19:50 PMby Mike Carr, CMT
Testing inspired by silver's big plunge last week showed that futures are just as likely to drop further as they are to rebound after a crash. Testing in the stock market finds buying big drops works best in bear markets.
Position: N/A
| Big drops in stocks, like what we saw in silver last week, occur more often than many traders think. I looked at a database of a little more than 8,000 stock symbols to see what happened the week after a decline of 30% or more takes place. There have been at least 100 trades a year going back to 1993, and several years before then with at least that many trades. Buying each stock after the dip shows a win rate of about 55% a week later. The profit factor, a deceptive measure frequently used by traders to assess a strategy, is a respectable 1.35. |
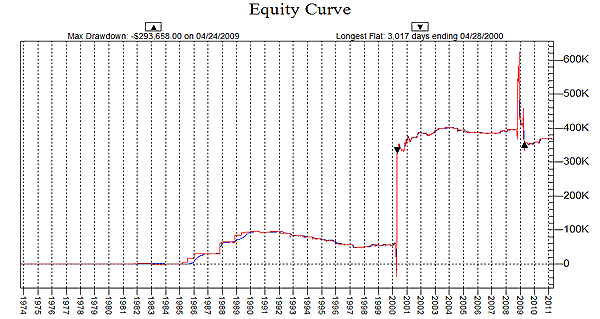
| Most of the wins came in only three years -- 1987, 2000, and 2008. Over 30% of the trades occurred in 2008 alone, when stocks fell sharply for the year. The system's profitability over more than 30 years of testing is almost solely attributable to that year. The bear market of 2000 also contributed to the equity curve shown in Figure 1. |

|
| FIGURE 1. Trading in only two short periods drive system results that appear tradable at first glance. |
| Graphic provided by: Trade Navigator. |
| |
| Buying dips is not a short-term trading strategy that works in the long term. When the overall market declines sharply, a bounce back seems likely. But in individual stocks, the idea is similar to trying to catch a falling knife. The sharp decline is probably based on events that merit a lower valuation of the stock. |
| Traders can learn a simple lesson from these tests: bottom picking is tempting, but will most likely not work very often. |
Mike Carr, CMT, is a member of the Market Technicians Association, and editor of the MTA's newsletter, Technically Speaking. He is also the author of "Smarter Investing in Any Economy: The Definitive Guide to Relative Strength Investing," and "Conquering the Divide: How to Use Economic Indicators to Catch Stock Market Trends."
| Website: | www.moneynews.com/blogs/MichaelCarr/id-73 |
| E-mail address: | marketstrategist@gmail.com |
Click here for more information about our publications!
Comments

|

Request Information From Our Sponsors
- StockCharts.com, Inc.
- Candle Patterns
- Candlestick Charting Explained
- Intermarket Technical Analysis
- John Murphy on Chart Analysis
- John Murphy's Chart Pattern Recognition
- John Murphy's Market Message
- MurphyExplainsMarketAnalysis-Intermarket Analysis
- MurphyExplainsMarketAnalysis-Visual Analysis
- StockCharts.com
- Technical Analysis of the Financial Markets
- The Visual Investor
- VectorVest, Inc.
- Executive Premier Workshop
- One-Day Options Course
- OptionsPro
- Retirement Income Workshop
- Sure-Fire Trading Systems (VectorVest, Inc.)
- Trading as a Business Workshop
- VectorVest 7 EOD
- VectorVest 7 RealTime/IntraDay
- VectorVest AutoTester
- VectorVest Educational Services
- VectorVest OnLine
- VectorVest Options Analyzer
- VectorVest ProGraphics v6.0
- VectorVest ProTrader 7
- VectorVest RealTime Derby Tool
- VectorVest Simulator
- VectorVest Variator
- VectorVest Watchdog
