HOT TOPICS LIST
- MACD
- Fibonacci
- RSI
- Gann
- ADXR
- Stochastics
- Volume
- Triangles
- Futures
- Cycles
- Volatility
- ZIGZAG
- MESA
- Retracement
- Aroon
INDICATORS LIST
LIST OF TOPICS
PRINT THIS ARTICLE
by Jamie Theiss
Here are two technical indicators trigger for a bullish swing trade.
Position: Buy
Jamie Theiss
Jamie Theiss is a full-time trader who daytrades stocks, swing trades forex, and from time to time position trades commodities.
PRINT THIS ARTICLE
REVERSAL
Two Reasons To Buy The USD/JPY Now
05/09/11 11:46:51 AMby Jamie Theiss
Here are two technical indicators trigger for a bullish swing trade.
Position: Buy
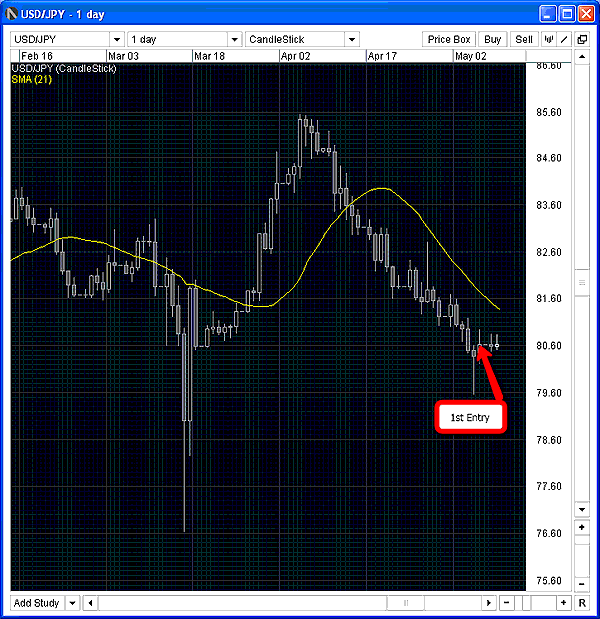
| The US dollar/yen (USD/JPY) pair has been on a downtrend now for 26 days or so. After such an extended run to the downside, it is now time for a correction, and Thursday's bottom tail bar on the daily chart (Figure 1) is the first indicator. Whenever a bottoming tail bar forms below and away from the 21-period simple moving average (SMA), that is a significant indicator for reversal. Daily bars are not formed by retail traders like you and me. Only institutions can form big bars, and this bottoming tail bar shows a major switch in the conviction and sentiment of those institutions. At its bottom, that bar was extremely bearish and something caused the institutions to change their mind and begin to buy it, causing the bar to become very bullish. |

|
| FIGURE 1: USD/JPY. My first entry is above the high of the bottom tail bar. |
| Graphic provided by: Oanda. |
| |
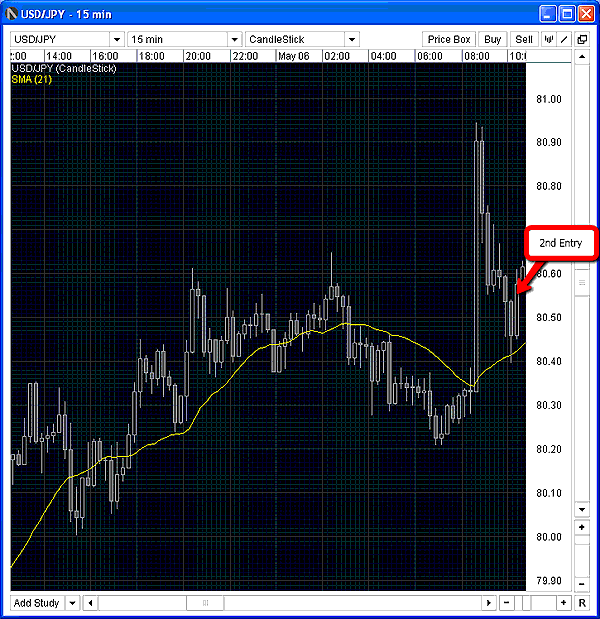
| The second technical reason was on Friday morning. Note the very bullish igniting 15-minute bar. You can't miss it; it is the biggest bar by far on the 15-minute chart. Again, retail traders cannot make a big bar like that. The institutions were accumulating heavily during that bar's formation. If institutions are buying heavily, I like to ride their coattails. I don't want to go against them. See Figure 2. |

|
| FIGURE 2: USD/JPY. My second entry triggered off the pullback to the 21-period SMA on the 15-minute chart. |
| Graphic provided by: Oanda. |
| |
| So what are my entries and where do I think it will ultimately go? My first entry was when the high of the bottoming tail was taken out at 80.62 with a protective stop under the bottoming tail bar at 79.45. The low of that bar was 79.56, but I like to give it several pips in case of stop running. And because this is a countertrend trade, I only entered with a fifth of my total position on my first entry. My second entry was the buy setup off the 15-minute igniting bar. I bought on the retracement to the 21-period SMA at 80.55 with a stop at the same location, under that low of that daily bottom tail bar. Now I am in with two-fifth of my total entry. I don't like to hold full size going into the weekend. If this were forming on a Monday or Tuesday, however, I would be buying more aggressively. |
| My next entry will be when the high of Friday's bar is taken out at 80.95. I will enter with another two-fifths bringing my total to four-fifths total size. I may not enter with the last one-fifth if it runs fast. I will look to enter my last piece if it pulls back and give me another buy setup, yet stays above the low of the bottom tail bar. |
| My target is a 50% retracement of the downtrend, which is around 82.50. However, since this is a countertrend trade, I will scale out just like I scaled in. My method is one-fifth out at 81.50, another fifth out at 82.00, and another fifth at 82.50. I will hold the last fifth for a potential large runup. After my first target is hit at 81.50, I will move my protective stop to break even on all the remaining lots. Other trade management systems can yield the same or greater profits. |
Jamie Theiss is a full-time trader who daytrades stocks, swing trades forex, and from time to time position trades commodities.
| E-mail address: | jamie_theiss@yahoo.com |
Click here for more information about our publications!
PRINT THIS ARTICLE

Request Information From Our Sponsors
- StockCharts.com, Inc.
- Candle Patterns
- Candlestick Charting Explained
- Intermarket Technical Analysis
- John Murphy on Chart Analysis
- John Murphy's Chart Pattern Recognition
- John Murphy's Market Message
- MurphyExplainsMarketAnalysis-Intermarket Analysis
- MurphyExplainsMarketAnalysis-Visual Analysis
- StockCharts.com
- Technical Analysis of the Financial Markets
- The Visual Investor
- VectorVest, Inc.
- Executive Premier Workshop
- One-Day Options Course
- OptionsPro
- Retirement Income Workshop
- Sure-Fire Trading Systems (VectorVest, Inc.)
- Trading as a Business Workshop
- VectorVest 7 EOD
- VectorVest 7 RealTime/IntraDay
- VectorVest AutoTester
- VectorVest Educational Services
- VectorVest OnLine
- VectorVest Options Analyzer
- VectorVest ProGraphics v6.0
- VectorVest ProTrader 7
- VectorVest RealTime Derby Tool
- VectorVest Simulator
- VectorVest Variator
- VectorVest Watchdog
