HOT TOPICS LIST
- MACD
- Fibonacci
- RSI
- Gann
- ADXR
- Stochastics
- Volume
- Triangles
- Futures
- Cycles
- Volatility
- ZIGZAG
- MESA
- Retracement
- Aroon
INDICATORS LIST
LIST OF TOPICS
PRINT THIS ARTICLE
by Koos van der Merwe
Elliott waves are only a signpost in the wilderness and can change at the next sign.
Position: Accumulate
Koos van der Merwe
Has been a technical analyst since 1969, and has worked as a futures and options trader with First Financial Futures in Johannesburg, South Africa.
PRINT THIS ARTICLE
ELLIOTT WAVE
Two Counts For The S&P 100
05/09/11 08:53:47 AMby Koos van der Merwe
Elliott waves are only a signpost in the wilderness and can change at the next sign.
Position: Accumulate
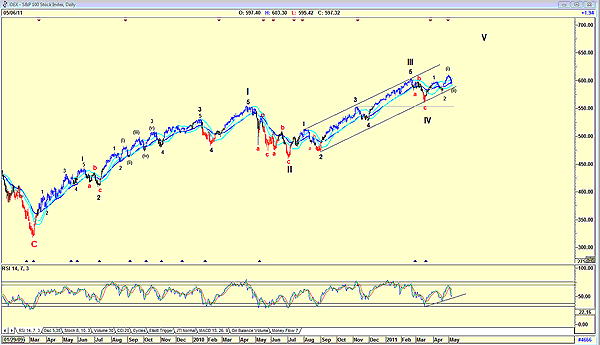
| I have always believed that Elliott waves are only a signpost in the wilderness of technical analysis, and that one should never become fixated on a particular count but should be open to a change as the market develops. Toward this end, I offer the following two versions of a wave count for the Standard & Poor's 100. Only time will tell which version is correct. For the short term, though, both versions are bullish. |

|
| FIGURE 1: S&P 100, DAILY |
| Graphic provided by: AdvancedGET. |
| |
| Figure 1, a daily chart of the S&P 100, suggests that the wave is tracing a wave (iii) of wave 3 of wave 3 of wave III. Sounds complicated, and it is, but it follows the first rule of Elliott wave theory. It looks correct. Wave III must be greater than wave I, which means that there is still some way to go before wave III is complete. Do note that the relative strength index (RSI) is showing strength. |

|
| FIGURE 2: S&P 100, DAILY |
| Graphic provided by: AdvancedGET. |
| |
| Figure 2 of the S&P 100 suggests that wave III is complete. Should this be true, then wave III is shorter than wave I, which means that wave V will be shorter than wave III, and difficult to project its top. Once again do note the RSI, which is suggesting strength. Whichever count is the correct one, and only time will tell, both are looking positive, with Figure 1 for the long term, and Figure 2 for a shorter term. |
Has been a technical analyst since 1969, and has worked as a futures and options trader with First Financial Futures in Johannesburg, South Africa.
| Address: | 3256 West 24th Ave |
| Vancouver, BC | |
| Phone # for sales: | 6042634214 |
| E-mail address: | petroosp@gmail.com |
Click here for more information about our publications!
PRINT THIS ARTICLE

Request Information From Our Sponsors
- StockCharts.com, Inc.
- Candle Patterns
- Candlestick Charting Explained
- Intermarket Technical Analysis
- John Murphy on Chart Analysis
- John Murphy's Chart Pattern Recognition
- John Murphy's Market Message
- MurphyExplainsMarketAnalysis-Intermarket Analysis
- MurphyExplainsMarketAnalysis-Visual Analysis
- StockCharts.com
- Technical Analysis of the Financial Markets
- The Visual Investor
- VectorVest, Inc.
- Executive Premier Workshop
- One-Day Options Course
- OptionsPro
- Retirement Income Workshop
- Sure-Fire Trading Systems (VectorVest, Inc.)
- Trading as a Business Workshop
- VectorVest 7 EOD
- VectorVest 7 RealTime/IntraDay
- VectorVest AutoTester
- VectorVest Educational Services
- VectorVest OnLine
- VectorVest Options Analyzer
- VectorVest ProGraphics v6.0
- VectorVest ProTrader 7
- VectorVest RealTime Derby Tool
- VectorVest Simulator
- VectorVest Variator
- VectorVest Watchdog
