HOT TOPICS LIST
- MACD
- Fibonacci
- RSI
- Gann
- ADXR
- Stochastics
- Volume
- Triangles
- Futures
- Cycles
- Volatility
- ZIGZAG
- MESA
- Retracement
- Aroon
INDICATORS LIST
LIST OF TOPICS
PRINT THIS ARTICLE
by Andrew Hetherington
The line formation is one that illustrates a balance in the supply and demand equation. In other words, the buyers and sellers are equal in this congestion area.
Position: N/A
Andrew Hetherington
Classic Dow Theorist who trades as a pure technician, using pattern recognition.
PRINT THIS ARTICLE
CHART ANALYSIS
Line Formations
03/15/02 11:07:42 AMby Andrew Hetherington
The line formation is one that illustrates a balance in the supply and demand equation. In other words, the buyers and sellers are equal in this congestion area.
Position: N/A
| For a line formation, the rules are simply having the daily price fluctuations within a 5% range and that the volume should diminish throughout the pattern. The duration of this style of pattern is between two weeks and two months, which must be accompanied with a breakout in either direction. This is not a very common pattern. In fact, they are uncommon in comparison to triangles, rectangles and head and shoulders patterns. Many confuse true line patterns with small rectangles. One last point is that there is no early warning to give any indication which way the breakout will occur thus making it impossible to trade within the pattern. If you want to trade line formations then you must await confirmation. |
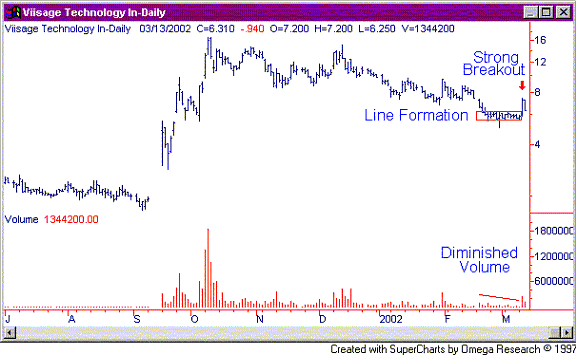
| Figure 1 shows a daily chart of VISG that I've spread out for a clearer picture. This chart conforms to all the necessary rules, and has a very strong breakout. Some would argue that this chart is slightly more than 5% from top to bottom. However, if you draw a conservative line, which is what I suggest, then you end up with a line pattern. When drawing your trendlines, being conservative will help you stay out of trouble. |

|
| Figure 1: Daily chart for VISG. |
| Graphic provided by: SuperCharts. |
| |
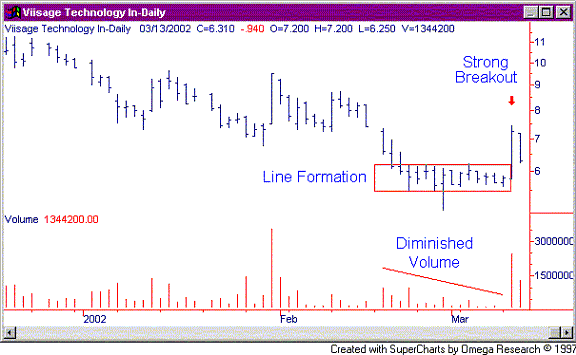
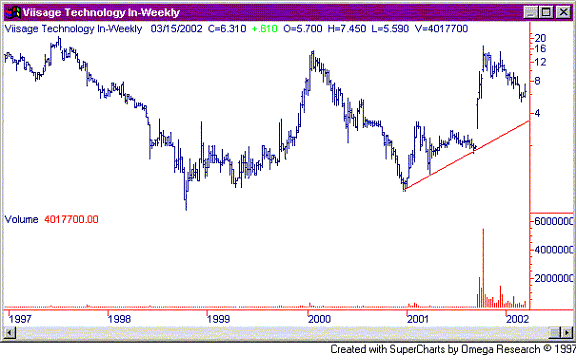
 Figure 2: Daily chart for VISG. In Figure 2 we have the same chart condensed. You can easily see the straight line-- more or less. As for the expected return on this chart, these have a tendency to be at the bottoms or the tops. Buying long after there is a throwback in the $5.50 - $6.00 area is considered a good entry point and it should give a good return eventually. However, I consider this particular equity in a state of drift. I sense underlying weakness and I wouldn't trade it either way. The longer-term trend suggests that buying long is near the $4.00 area on the trendline in Figure 3. |
 Figure 3: Weekly chart for VISG. A word of caution is necessary for line formations since they are very difficult to diagnose correctly. Occasionally, patterns can break down and go in the opposite direction of what you expect. I don't trust it, so I look for other opportunities. If you absolutely want to trade it then a tight stop-loss is necessary to limit your downside risk. On the other hand, if it skyrockets I won't be upset, since it is better to be safe than sorry with these tricky patterns. |
Classic Dow Theorist who trades as a pure technician, using pattern recognition.
| Toronto, Canada |
Click here for more information about our publications!
Comments
Date: 03/15/02Rank: 4Comment:
Date: 03/16/02Rank: 5Comment:
Date: 03/19/02Rank: 4Comment:
Date: 12/13/02Rank: 3Comment:

Request Information From Our Sponsors
- VectorVest, Inc.
- Executive Premier Workshop
- One-Day Options Course
- OptionsPro
- Retirement Income Workshop
- Sure-Fire Trading Systems (VectorVest, Inc.)
- Trading as a Business Workshop
- VectorVest 7 EOD
- VectorVest 7 RealTime/IntraDay
- VectorVest AutoTester
- VectorVest Educational Services
- VectorVest OnLine
- VectorVest Options Analyzer
- VectorVest ProGraphics v6.0
- VectorVest ProTrader 7
- VectorVest RealTime Derby Tool
- VectorVest Simulator
- VectorVest Variator
- VectorVest Watchdog
- StockCharts.com, Inc.
- Candle Patterns
- Candlestick Charting Explained
- Intermarket Technical Analysis
- John Murphy on Chart Analysis
- John Murphy's Chart Pattern Recognition
- John Murphy's Market Message
- MurphyExplainsMarketAnalysis-Intermarket Analysis
- MurphyExplainsMarketAnalysis-Visual Analysis
- StockCharts.com
- Technical Analysis of the Financial Markets
- The Visual Investor
