HOT TOPICS LIST
- MACD
- Fibonacci
- RSI
- Gann
- ADXR
- Stochastics
- Volume
- Triangles
- Futures
- Cycles
- Volatility
- ZIGZAG
- MESA
- Retracement
- Aroon
INDICATORS LIST
LIST OF TOPICS
PRINT THIS ARTICLE
by Mike Carr, CMT
While bulls and bears continue to debate the fate of silver, we can look at cotton to see what it looks like after the bubble bursts.
Position: Sell
Mike Carr, CMT
Mike Carr, CMT, is a member of the Market Technicians Association, and editor of the MTA's newsletter, Technically Speaking. He is also the author of "Smarter Investing in Any Economy: The Definitive Guide to Relative Strength Investing," and "Conquering the Divide: How to Use Economic Indicators to Catch Stock Market Trends."
PRINT THIS ARTICLE
RATE CHANGE - PRICE
After The Bubble, Cotton Offers A Lesson
05/04/11 08:25:12 AMby Mike Carr, CMT
While bulls and bears continue to debate the fate of silver, we can look at cotton to see what it looks like after the bubble bursts.
Position: Sell
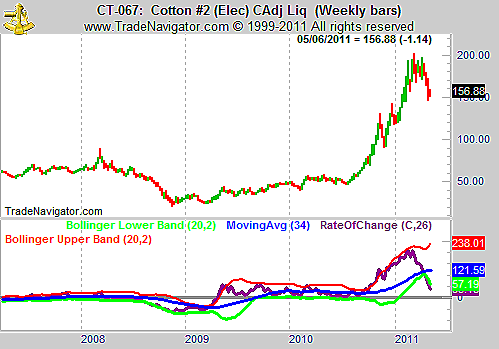
| Cotton bulls enjoyed a tremendous gain of more than 300% from July 2010 into the March 2011 top. Prices didn't move straight up. A 30% correction in November undoubtedly scared some out of the market. Futures markets are highly leveraged and individuals tend to close positions as the losses move quickly. In November, the decline was compressed into only two weeks. Small speculator positions fell by 25% over that time, confirming that they can easily change their minds and get out of a market as quickly as they got in. |
| Figure 1 shows the weekly chart of cotton, along with the rate of change (ROC) indicator. The 26-week ROC was greater than 100% for almost six months, indicating a severely overbought market. The problem is, as always, no one knows how high an irrational market can go. We do see that ROC broke its upper Bollinger band and then fell back through that line right before the November decline, offering a potentially timely sell signal. |

|
| FIGURE 1: CT, WEEKLY. The weekly chart clearly shows the runaway bull market that cotton experienced over the past year. |
| Graphic provided by: Trade Navigator. |
| |
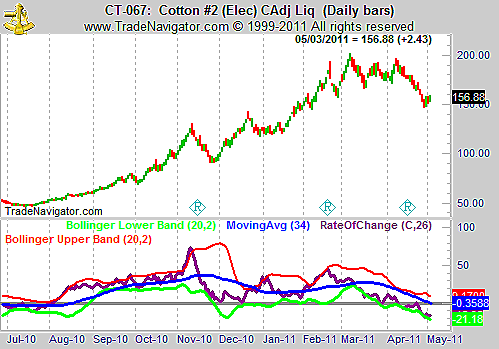
| The daily chart (Figure 2) shows a clear topping pattern forming since the beginning of 2011. Prices formed a rectangle or a triple top or even a head & shoulders pattern, as some claim to see. The name of the pattern is not as important as what the action indicates, which is a failure to continue moving higher and clear resistance. Momentum, again shown as the ROC, diverged sharply, indicating that the price action was stalling. |

|
| FIGURE 2: CT, DAILY. The daily chart of cotton shows a price top with a bearish momentum divergence. |
| Graphic provided by: Trade Navigator. |
| |
| Traders need to enjoy rapid gains where they are offered. But they cannot afford to ignore glaring sell signals like the one that cotton has offered in the past several months. |
Mike Carr, CMT, is a member of the Market Technicians Association, and editor of the MTA's newsletter, Technically Speaking. He is also the author of "Smarter Investing in Any Economy: The Definitive Guide to Relative Strength Investing," and "Conquering the Divide: How to Use Economic Indicators to Catch Stock Market Trends."
| Website: | www.moneynews.com/blogs/MichaelCarr/id-73 |
| E-mail address: | marketstrategist@gmail.com |
Click here for more information about our publications!
PRINT THIS ARTICLE

Request Information From Our Sponsors
- StockCharts.com, Inc.
- Candle Patterns
- Candlestick Charting Explained
- Intermarket Technical Analysis
- John Murphy on Chart Analysis
- John Murphy's Chart Pattern Recognition
- John Murphy's Market Message
- MurphyExplainsMarketAnalysis-Intermarket Analysis
- MurphyExplainsMarketAnalysis-Visual Analysis
- StockCharts.com
- Technical Analysis of the Financial Markets
- The Visual Investor
- VectorVest, Inc.
- Executive Premier Workshop
- One-Day Options Course
- OptionsPro
- Retirement Income Workshop
- Sure-Fire Trading Systems (VectorVest, Inc.)
- Trading as a Business Workshop
- VectorVest 7 EOD
- VectorVest 7 RealTime/IntraDay
- VectorVest AutoTester
- VectorVest Educational Services
- VectorVest OnLine
- VectorVest Options Analyzer
- VectorVest ProGraphics v6.0
- VectorVest ProTrader 7
- VectorVest RealTime Derby Tool
- VectorVest Simulator
- VectorVest Variator
- VectorVest Watchdog
