HOT TOPICS LIST
- MACD
- Fibonacci
- RSI
- Gann
- ADXR
- Stochastics
- Volume
- Triangles
- Futures
- Cycles
- Volatility
- ZIGZAG
- MESA
- Retracement
- Aroon
INDICATORS LIST
LIST OF TOPICS
PRINT THIS ARTICLE
by Mike Carr, CMT
Some chart patterns are commonly used to develop price targets. That same principle can help traders even when there isn't a clearly discernible pattern.
Position: Buy
Mike Carr, CMT
Mike Carr, CMT, is a member of the Market Technicians Association, and editor of the MTA's newsletter, Technically Speaking. He is also the author of "Smarter Investing in Any Economy: The Definitive Guide to Relative Strength Investing," and "Conquering the Divide: How to Use Economic Indicators to Catch Stock Market Trends."
PRINT THIS ARTICLE
CHART ANALYSIS
Projecting Price Targets
05/02/11 03:47:54 PMby Mike Carr, CMT
Some chart patterns are commonly used to develop price targets. That same principle can help traders even when there isn't a clearly discernible pattern.
Position: Buy
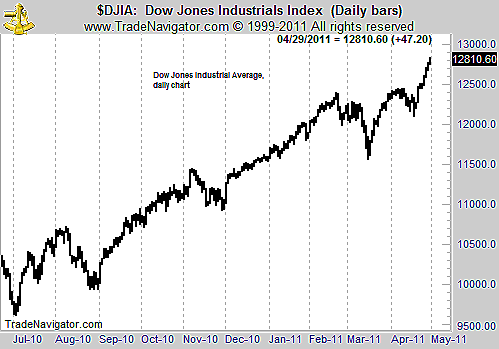
| The recent action in stock markets has been mostly straight up. The daily chart, shown in Figure 1, shows the recent break to new highs. The chart also shows that after the resistance level was cleared, there are no significant price targets visible in the chart. |

|
| FIGURE 1: DJIA, DAILY. Charts donít always offer clear patterns. |
| Graphic provided by: Trade Navigator. |
| |
| Some patterns, like a head & shoulders, are used to create price targets. The guideline is that the price will fall in an amount equal to the distance between the neckline and the high point of the head. Rectangles also offer a price target based upon the distance between the high and low prices formed by the pattern. In both cases, and with most chart patterns, the objective is based upon symmetry. The idea is that the subsequent price move will be as large as the previous price move. |

|
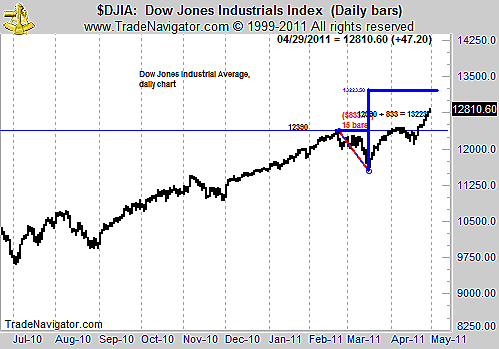
| FIGURE 2: DJIA, DAILY. The Dow Jones Industrial Average (DJIA) fell more than 830 points from its February high to its March low. |
| Graphic provided by: Trade Navigator. |
| |
| This idea has been applied to the chart in Figure 2. The Dow Jones Industrial Average (DJIA) feel more than 830 points from its February high to its March low. Once prices broke back above the February high, the idea of symmetry yields a target of 13,223. Of course the precision is deceptive, but a move to 13,200 or so seems probable. |
| Technical analysis is based on general principles. Too many technicians would prefer to find a precise pattern rather than generalize the concepts of pattern analysis. The simple idea of symmetrical moves is clearly contained in setting price objectives and can often be applied in uncertain conditions where no clear pattern can be seen. |
Mike Carr, CMT, is a member of the Market Technicians Association, and editor of the MTA's newsletter, Technically Speaking. He is also the author of "Smarter Investing in Any Economy: The Definitive Guide to Relative Strength Investing," and "Conquering the Divide: How to Use Economic Indicators to Catch Stock Market Trends."
| Website: | www.moneynews.com/blogs/MichaelCarr/id-73 |
| E-mail address: | marketstrategist@gmail.com |
Click here for more information about our publications!
PRINT THIS ARTICLE

Request Information From Our Sponsors
- StockCharts.com, Inc.
- Candle Patterns
- Candlestick Charting Explained
- Intermarket Technical Analysis
- John Murphy on Chart Analysis
- John Murphy's Chart Pattern Recognition
- John Murphy's Market Message
- MurphyExplainsMarketAnalysis-Intermarket Analysis
- MurphyExplainsMarketAnalysis-Visual Analysis
- StockCharts.com
- Technical Analysis of the Financial Markets
- The Visual Investor
- VectorVest, Inc.
- Executive Premier Workshop
- One-Day Options Course
- OptionsPro
- Retirement Income Workshop
- Sure-Fire Trading Systems (VectorVest, Inc.)
- Trading as a Business Workshop
- VectorVest 7 EOD
- VectorVest 7 RealTime/IntraDay
- VectorVest AutoTester
- VectorVest Educational Services
- VectorVest OnLine
- VectorVest Options Analyzer
- VectorVest ProGraphics v6.0
- VectorVest ProTrader 7
- VectorVest RealTime Derby Tool
- VectorVest Simulator
- VectorVest Variator
- VectorVest Watchdog
