HOT TOPICS LIST
- MACD
- Fibonacci
- RSI
- Gann
- ADXR
- Stochastics
- Volume
- Triangles
- Futures
- Cycles
- Volatility
- ZIGZAG
- MESA
- Retracement
- Aroon
INDICATORS LIST
LIST OF TOPICS
PRINT THIS ARTICLE
by David Penn
After a bull market run from under 61 in October to over 68 in March, a head and shoulders top looks ready to take June hogs back down.
Position: N/A
David Penn
Technical Writer for Technical Analysis of STOCKS & COMMODITIES magazine, Working-Money.com, and Traders.com Advantage.
PRINT THIS ARTICLE
HEAD & SHOULDERS
A Head and Shoulders Top in Hogs
03/14/02 01:40:35 PMby David Penn
After a bull market run from under 61 in October to over 68 in March, a head and shoulders top looks ready to take June hogs back down.
Position: N/A
| Allow me to put in a plug for maintaining your own futures chartbook. If ever your confidence in the vitality of technical analysis should start to wane, then a few minutes (or hours) paging through a chartbook of selected futures over a variety of time frames might be just the antidote. |
| That said, I was looking over some longer-term charts of commodity futures last night and noticed that the continuous lean hogs contract, which had been oscillating wildly on the longer-term chart (1982-2002), seemed a great deal more rational on a slightly shorter time frame (1999-2002). Here, those wild oscillations became a series of peaks that were rising up until the spring of 2000 (these peaks come in October 1998, May 1999, and May 2000). After this point, a similar series of peaks is found--only this series is descending: an April 2001 peak fell just shy of the previous May 2000 peak and the current price action in lean hogs headed toward a peak in the spring of 2002 that falls short of the April 2001 peak. |

|
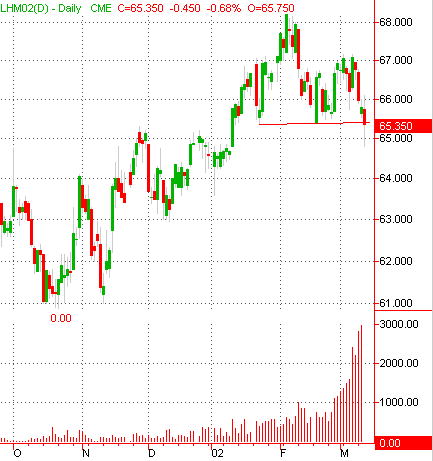
| If support breaks down at 65.5, then June hogs could fall as low as 62.5. |
| Graphic provided by: TradeStation. |
| |
| This information helped paint a bearish picture for lean hogs. Noting corrective resistance around 49-50 in the continuous lean hogs contract, I went in for a closer look at nearby months to see if indeed short opportunities existed in tradable contracts. In this manner, the June lean hogs contract does not disappoint. |
| June lean hogs have just ended a bull market advance from a double bottom in the fall of 2001 (trough low of 61.25) to an early February peak at 68. This peak, as the chart shows, looks to be developing into a head and shoulders top, with its minor peaks in mid-January and mid-February. Prices have yet to break down, as the 65.5 level (the neckline of the pattern) is proving to be worthy support. However, the high volume on the right side of the formation as prices decline is bearishly ominous for lean hogs. |
| Where would a downside breakdown in the June lean hogs contract end up? Given the formation size of about 2.8, a downside target of around 62.5 would be expected. Such a decline does not seem like it would offer a serious test of the fall 2001 lows--at least not on the first attempt. For now, however, the emphasis is on the bears' ability to drive June lean hogs beneath 65.5--and to keep them there. |
Technical Writer for Technical Analysis of STOCKS & COMMODITIES magazine, Working-Money.com, and Traders.com Advantage.
| Title: | Technical Writer |
| Company: | Technical Analysis, Inc. |
| Address: | 4757 California Avenue SW |
| Seattle, WA 98116 | |
| Phone # for sales: | 206 938 0570 |
| Fax: | 206 938 1307 |
| Website: | www.Traders.com |
| E-mail address: | DPenn@traders.com |
Traders' Resource Links | |
| Charting the Stock Market: The Wyckoff Method -- Books | |
| Working-Money.com -- Online Trading Services | |
| Traders.com Advantage -- Online Trading Services | |
| Technical Analysis of Stocks & Commodities -- Publications and Newsletters | |
| Working Money, at Working-Money.com -- Publications and Newsletters | |
| Traders.com Advantage -- Publications and Newsletters | |
| Professional Traders Starter Kit -- Software | |
Click here for more information about our publications!
Comments
Date: 12/13/02Rank: 2Comment: More charts with price levels are needed.

Request Information From Our Sponsors
- StockCharts.com, Inc.
- Candle Patterns
- Candlestick Charting Explained
- Intermarket Technical Analysis
- John Murphy on Chart Analysis
- John Murphy's Chart Pattern Recognition
- John Murphy's Market Message
- MurphyExplainsMarketAnalysis-Intermarket Analysis
- MurphyExplainsMarketAnalysis-Visual Analysis
- StockCharts.com
- Technical Analysis of the Financial Markets
- The Visual Investor
- VectorVest, Inc.
- Executive Premier Workshop
- One-Day Options Course
- OptionsPro
- Retirement Income Workshop
- Sure-Fire Trading Systems (VectorVest, Inc.)
- Trading as a Business Workshop
- VectorVest 7 EOD
- VectorVest 7 RealTime/IntraDay
- VectorVest AutoTester
- VectorVest Educational Services
- VectorVest OnLine
- VectorVest Options Analyzer
- VectorVest ProGraphics v6.0
- VectorVest ProTrader 7
- VectorVest RealTime Derby Tool
- VectorVest Simulator
- VectorVest Variator
- VectorVest Watchdog
