HOT TOPICS LIST
- MACD
- Fibonacci
- RSI
- Gann
- ADXR
- Stochastics
- Volume
- Triangles
- Futures
- Cycles
- Volatility
- ZIGZAG
- MESA
- Retracement
- Aroon
INDICATORS LIST
LIST OF TOPICS
PRINT THIS ARTICLE
by Austin Passamonte
Here's the near-term view of the S&P 500 futures market.
Position: N/A
Austin Passamonte
Austin is a private trader who trades emini stock index futures intraday. He currently trades various futures markets from home in addition to managing a trader's educational forum
PRINT THIS ARTICLE
TECHNICAL ANALYSIS
Broken Neck
04/29/11 12:37:16 PMby Austin Passamonte
Here's the near-term view of the S&P 500 futures market.
Position: N/A
| Stock index markets have bounced sharply from each sudden pullback for the past two years since historical lows went in place. Fueled solely by the Federal Reserve's quantitative easing (QE) and QEII programs (POMO) for the relentless overnight gaps and relentless drifts upward, price is once again at a crossroads of action zone now. |

|
| FIGURE 1: ES, DAILY |
| Graphic provided by: NinjaTrader. |
| |
| Clearly visible on any longer-term chart are distinct head & shoulders patterns for stock index markets. The S&P 500 shows left & right shoulders in place, crown of head near 1240 and neckline of resistance near 1330 - 1340, depending on which form of measurement one uses. |
| Pattern lows from 1240 to a high near 1340 give a 100-point measurement of width. That projects upwards from the neckline a similar distance, giving the general ES 1440 zone credence to traders who value head & shoulders patterns. See Figure 2. |

|
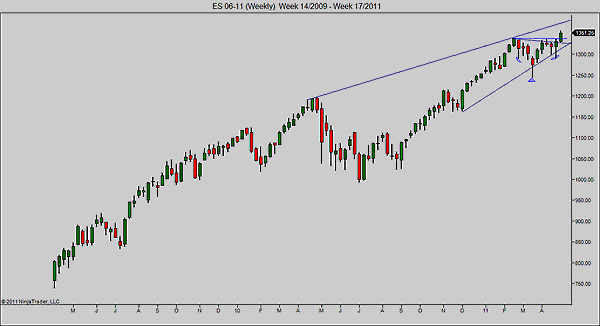
| FIGURE 2: ES, WEEKLY |
| Graphic provided by: NinjaTrader. |
| |
| Stretching that same view out to a weekly chart, we can see where ascending pennant formation brings a trendline resistance into play somewhat above the current resting price. That would be the next zone of congestion higher to mark. Likewise, it will take a break and close below the neckline near 1330 lows to negate this progression and turn it into a failed pattern sell signal instead. |
| Price action basing at or above 1330 to 1340 zone is bullish. A break & close that bases below 1330 zone is bearish. Pretty clear lines in the sand to work around from there. |
Austin is a private trader who trades emini stock index futures intraday. He currently trades various futures markets from home in addition to managing a trader's educational forum
| Title: | Individual Trader |
| Company: | CoiledMarkets.com |
| Address: | PO Box 633 |
| Naples, NY 14512 | |
| Website: | coiledmarkets.com/blog |
| E-mail address: | austinp44@yahoo.com |
Traders' Resource Links | |
| CoiledMarkets.com has not added any product or service information to TRADERS' RESOURCE. | |
Click here for more information about our publications!
PRINT THIS ARTICLE

|

Request Information From Our Sponsors
- StockCharts.com, Inc.
- Candle Patterns
- Candlestick Charting Explained
- Intermarket Technical Analysis
- John Murphy on Chart Analysis
- John Murphy's Chart Pattern Recognition
- John Murphy's Market Message
- MurphyExplainsMarketAnalysis-Intermarket Analysis
- MurphyExplainsMarketAnalysis-Visual Analysis
- StockCharts.com
- Technical Analysis of the Financial Markets
- The Visual Investor
- VectorVest, Inc.
- Executive Premier Workshop
- One-Day Options Course
- OptionsPro
- Retirement Income Workshop
- Sure-Fire Trading Systems (VectorVest, Inc.)
- Trading as a Business Workshop
- VectorVest 7 EOD
- VectorVest 7 RealTime/IntraDay
- VectorVest AutoTester
- VectorVest Educational Services
- VectorVest OnLine
- VectorVest Options Analyzer
- VectorVest ProGraphics v6.0
- VectorVest ProTrader 7
- VectorVest RealTime Derby Tool
- VectorVest Simulator
- VectorVest Variator
- VectorVest Watchdog
