HOT TOPICS LIST
- MACD
- Fibonacci
- RSI
- Gann
- ADXR
- Stochastics
- Volume
- Triangles
- Futures
- Cycles
- Volatility
- ZIGZAG
- MESA
- Retracement
- Aroon
INDICATORS LIST
LIST OF TOPICS
PRINT THIS ARTICLE
by Chaitali Mohile
Tiffany is likely to open fresh buying opportunities with the current breakout.
Position: Buy
Chaitali Mohile
Active trader in the Indian stock markets since 2003 and a full-time writer. Trading is largely based upon technical analysis.
PRINT THIS ARTICLE
CONSOLID FORMATION
Tiffany Moves Out Of Consolidation Range
04/28/11 01:58:58 PMby Chaitali Mohile
Tiffany is likely to open fresh buying opportunities with the current breakout.
Position: Buy
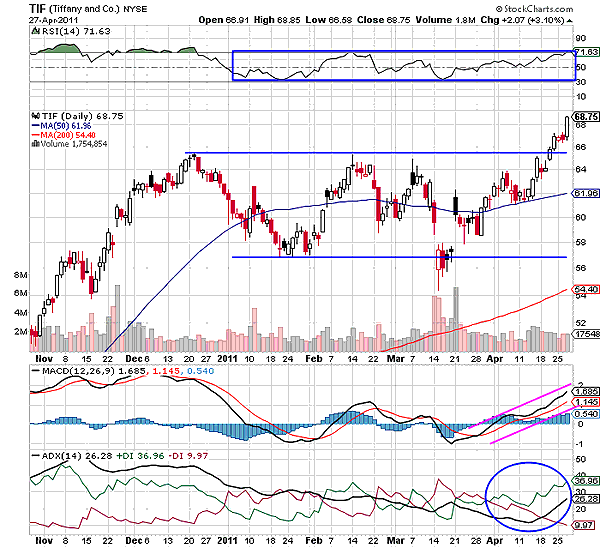
| Tiffany and Co. (TIF) entered a wide consolidation range in January 2011. The stock moved sideways for about four months, respecting the upper and lower range at 65-57. The trading range being wide, we can see fluctuating volume along with the price action. The buying volume increased as the price rallied from lower to upper range and vice versa. In Figure 1, we can see the relative strength index (RSI) (14) also moved between the 70-30 levels, indicating a weak strength in the sideways rally. During consolidation, the stock has to face high volatility. The shaky moving average convergence/divergence (MACD) (12,26,9) reflects volatility, and the converging positive and negative directional index (+DI) (-DI) shows consolidation period for TIF. |

|
| FIGURE 1: TIF, DAILY |
| Graphic provided by: StockCharts.com. |
| |
| The range-bound rally of TIF looks like it is about to end. The stock has breached the upper range of $65. All the indicators are surging in the bullish zone. The ADX (14) is developing a fresh uptrend after the long tricky move between 15 and 20 levels. The MACD (12,26,9) turned positive and has already shifted above the zero line in positive territory. The RSI (14) is yet to break the overbought level (70), which should be observed carefully. However, the price chart shows that the stock has established support at an upper consolidation range. Therefore, the breakout is likely to sustain and continue its bullish journey. |
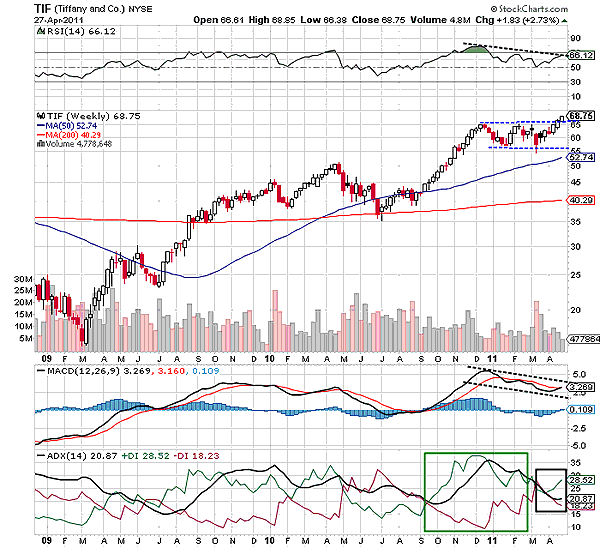
| On the weekly time frame, the four months consolidation period has formed a strong flag in Figure 2. A bullish flag & pennant continuation pattern is visible. The stock had begun an advance rally, with the robust support of the 50-day moving average (MA) at 45 levels. Gradually, TIF surged to 65 levels, earning a profit of $20. The consolidation that followed the advance rally formed the bullish continuation pattern. The uptrend descended to 20 levels due to the consolidated move of TIF; however, the strong buying pressure restricted short traders. Therefore, the uptrend could sustain even during the sideways price rally. The only point of concern is a negative divergence of the RSI (14) and the MACD (12,26,9). |

|
| FIGURE 2: TIF, WEEKLY |
| Graphic provided by: StockCharts.com. |
| |
| A bullish breakout of TIF would resume the prior bullish rally. The potential target for TIF would be 20 (length of the flag pole) + 65 (the breakout point) = 85. The flag & pennant is ready to break out, and the stock has to sustain above 65 levels for the confirmed breakout rally. Considering the oscillator's movement, the initial price action could be little slow. But traders and investors can definitely put TIF on the top of their list of potential long positions. |
Active trader in the Indian stock markets since 2003 and a full-time writer. Trading is largely based upon technical analysis.
| Company: | Independent |
| Address: | C1/3 Parth Indraprasth Towers. Vastrapur |
| Ahmedabad, Guj 380015 | |
| E-mail address: | chaitalimohile@yahoo.co.in |
Traders' Resource Links | |
| Independent has not added any product or service information to TRADERS' RESOURCE. | |
Click here for more information about our publications!
PRINT THIS ARTICLE

Request Information From Our Sponsors
- StockCharts.com, Inc.
- Candle Patterns
- Candlestick Charting Explained
- Intermarket Technical Analysis
- John Murphy on Chart Analysis
- John Murphy's Chart Pattern Recognition
- John Murphy's Market Message
- MurphyExplainsMarketAnalysis-Intermarket Analysis
- MurphyExplainsMarketAnalysis-Visual Analysis
- StockCharts.com
- Technical Analysis of the Financial Markets
- The Visual Investor
- VectorVest, Inc.
- Executive Premier Workshop
- One-Day Options Course
- OptionsPro
- Retirement Income Workshop
- Sure-Fire Trading Systems (VectorVest, Inc.)
- Trading as a Business Workshop
- VectorVest 7 EOD
- VectorVest 7 RealTime/IntraDay
- VectorVest AutoTester
- VectorVest Educational Services
- VectorVest OnLine
- VectorVest Options Analyzer
- VectorVest ProGraphics v6.0
- VectorVest ProTrader 7
- VectorVest RealTime Derby Tool
- VectorVest Simulator
- VectorVest Variator
- VectorVest Watchdog
