HOT TOPICS LIST
- MACD
- Fibonacci
- RSI
- Gann
- ADXR
- Stochastics
- Volume
- Triangles
- Futures
- Cycles
- Volatility
- ZIGZAG
- MESA
- Retracement
- Aroon
INDICATORS LIST
LIST OF TOPICS
PRINT THIS ARTICLE
by Koos van der Merwe
When you stand on the beach and watch the waves splash at your feet, you are watching a cycle caused by the gravity of the moon.
Position: Accumulate
Koos van der Merwe
Has been a technical analyst since 1969, and has worked as a futures and options trader with First Financial Futures in Johannesburg, South Africa.
PRINT THIS ARTICLE
CYCLES
A Cyclical Formation On FTI Consulting
04/28/11 08:21:55 AMby Koos van der Merwe
When you stand on the beach and watch the waves splash at your feet, you are watching a cycle caused by the gravity of the moon.
Position: Accumulate
| Why should a lunar cycle influence the share you buy? Simple. If lunar gravity can affect the ocean to the extent it does, then it should also affect human emotion because 90% of the body consists of liquid. However, a company also presents quarterly reports on a cyclical basis. The mantra is, "Buy the rumor, sell the news," so one buys the stock before the report is due, of course guesstimating that it will be a good report, and then sell the stock the day before the report is made public. That is the norm and the strategy followed by the majority of traders. |

|
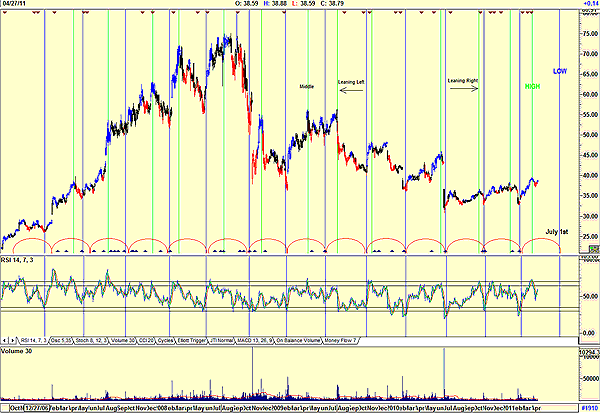
| FIGURE 1: FTI CONSULTING CYCLICAL CHART |
| Graphic provided by: AdvancedGET. |
| |
| Figure 1 is a daily chart of FTI Consulting and shows how the lows conform to a cyclical pattern formation. The semi circles on the chart show where the lows should occur. The vertical blue lines where the lows have occurred. This deviation occurs because quarterly reports are never exactly on the same date every quarter. The green vertical lines show the highs. Strictly speaking, they should occur in the middle of the lows, but they do not. In a rising market, they tend to lean toward the right, while in a falling market they lean toward the left. This means that the chart suggests the high has already occurred, and that the trend is now down. This is suggested by the relative strength index (RSI), which is suggesting that FTI Consulting should now weaken, and yes, it probably will, forming a low on July 1, allowing two days on either side for error. However, it is many days from today to July 1, and much can happen. For example, we could see a rise in the share price with a lower divergence high in the RSI, confirming a sell signal. One thing we do know, though. There will be a low on July 1, or close to that date and that it could be from a higher share price. Yes. Cycles are very important, and the simpler the cycle is, the better. So always keep that in mind when analyzing a chart. |
Has been a technical analyst since 1969, and has worked as a futures and options trader with First Financial Futures in Johannesburg, South Africa.
| Address: | 3256 West 24th Ave |
| Vancouver, BC | |
| Phone # for sales: | 6042634214 |
| E-mail address: | petroosp@gmail.com |
Click here for more information about our publications!
PRINT THIS ARTICLE

Request Information From Our Sponsors
- StockCharts.com, Inc.
- Candle Patterns
- Candlestick Charting Explained
- Intermarket Technical Analysis
- John Murphy on Chart Analysis
- John Murphy's Chart Pattern Recognition
- John Murphy's Market Message
- MurphyExplainsMarketAnalysis-Intermarket Analysis
- MurphyExplainsMarketAnalysis-Visual Analysis
- StockCharts.com
- Technical Analysis of the Financial Markets
- The Visual Investor
- VectorVest, Inc.
- Executive Premier Workshop
- One-Day Options Course
- OptionsPro
- Retirement Income Workshop
- Sure-Fire Trading Systems (VectorVest, Inc.)
- Trading as a Business Workshop
- VectorVest 7 EOD
- VectorVest 7 RealTime/IntraDay
- VectorVest AutoTester
- VectorVest Educational Services
- VectorVest OnLine
- VectorVest Options Analyzer
- VectorVest ProGraphics v6.0
- VectorVest ProTrader 7
- VectorVest RealTime Derby Tool
- VectorVest Simulator
- VectorVest Variator
- VectorVest Watchdog
