HOT TOPICS LIST
- MACD
- Fibonacci
- RSI
- Gann
- ADXR
- Stochastics
- Volume
- Triangles
- Futures
- Cycles
- Volatility
- ZIGZAG
- MESA
- Retracement
- Aroon
INDICATORS LIST
LIST OF TOPICS
PRINT THIS ARTICLE
by Billy Williams
"Buy on dips and sell on rallies" is good advice, but it leaves the question of how? A simple set of indicators can show you where "price respect" is and how to trade dips in price.
Position: Hold
Billy Williams
Billy Williams has been trading the markets for 27 years, specializing in momentum trading with stocks and options.
PRINT THIS ARTICLE
MOVING AVERAGES
How To Trade Price Respect For Moving Averages
04/28/11 01:36:55 PMby Billy Williams
"Buy on dips and sell on rallies" is good advice, but it leaves the question of how? A simple set of indicators can show you where "price respect" is and how to trade dips in price.
Position: Hold
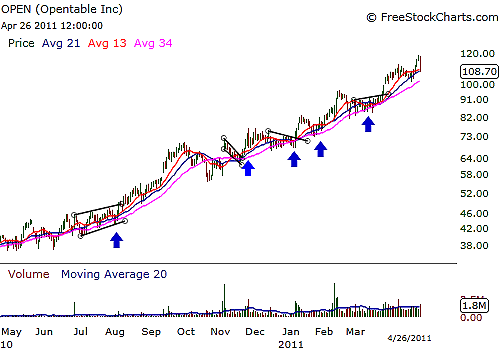
| "Buy on the dips and sell on the rallies" is one of those maxims that is passed down from one generation of traders to the next and is really good advice when approaching stock trading.While it's good advice, however, it doesn't do much as far as instruction goes on how to actually do it. Buying on dips is a form of pullback trading that when done correctly can give you a low-risk entry in a stock that is already trending. This leads to superior entries and greater profits down the line if you can time your trades at the proper juncture in a stock's price pullback just before it resumes its uptrend. See Figure 1. When a stock is dipping in price, however, pulling back from a previous high in the price action generates both opportunity as well as anxiety. The focal point for the source of anxiety is that when a stock is pulling back, several questions arise: "Is this a pullback? How far is the stock pulling back? Where do I buy? What if the stock keeps falling?" |

|
| FIGURE 1: OPEN. On a short-term time frame, OPEN found "price respect" several times along the 13-day, 21-day, and 34-day moving average, as they confirmed support on price dips as OPEN kept trading higher. |
| Graphic provided by: www.freestockcharts.com. |
| |
| These are normal questions when considering buying on dips, and they can cause you to freeze up at the precise time you should be pulling the trigger on the entry if you don't have a strategy to help you filter out weak pullbacks that can continue to fall versus the pullbacks that are just pauses in the market and about to continue higher. Fortunately, by studying how price reacts to a combination of moving averages, you can determine where price respects a particular moving average and finds support at that level and signals where you should consider a long position in a stock that is pulling back. |
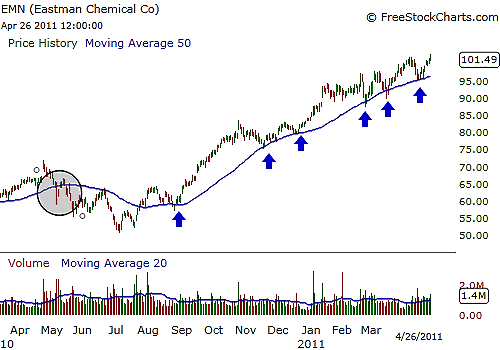
| Moving averages act as visual references to the average price movement of a particular stock or market over a set time period. You would be wise to use a combination of moving average time periods such as the 200-day, 100-day, and the 50-day moving averages when looking at intermediate- to long-term stock trades because these periods give you a complete bird's-eye view on how a particular stock is trading in respect to that moving average's time frame. For shorter-term trades, using a combination of 13-day, 21-day, and 34-day moving averages give you a strong visual reference of how a stock is trading on a short-term time scale for quick trades, in and out of the market. See Figure 2. |

|
| FIGURE 2: EMN. EMN intitially traded below the 50-day moving average before trending higher where on each price dip, the stock respected the 50-day moving average several times, offering a buy point before heading higher. |
| Graphic provided by: www.freestockcharts.com. |
| |
| Whatever time frame you are considering, the important thing to consider when studying price action and its relationship to showing support at a particular moving average is "price respect," meaning how price respects support at a particular moving average. For example, if price has been pulling back to the 50-day moving average and finding support, then it respects that moving average and you can plan on making a low-risk entry at that level as price resumes upward. But if price suddenly trades through that 50-day moving average, then price does not respect that moving average any longer and you should step aside. |
| Later, if price finds support at the next moving average -- the 100-day -- then respect for that new level has been established and you readjust your trading approach accordingly. You can also observe the trading volume as price touches down on a moving average to help discern whether price is simply pulling back on light volume or heavy volume, and judge whether the stock is under distribution and if it would be better to step aside till price respect is confirmed at a new moving average. |
Billy Williams has been trading the markets for 27 years, specializing in momentum trading with stocks and options.
| Company: | StockOptionSystem.com |
| E-mail address: | stockoptionsystem.com@gmail.com |
Traders' Resource Links | |
| StockOptionSystem.com has not added any product or service information to TRADERS' RESOURCE. | |
Click here for more information about our publications!
PRINT THIS ARTICLE

Request Information From Our Sponsors
- VectorVest, Inc.
- Executive Premier Workshop
- One-Day Options Course
- OptionsPro
- Retirement Income Workshop
- Sure-Fire Trading Systems (VectorVest, Inc.)
- Trading as a Business Workshop
- VectorVest 7 EOD
- VectorVest 7 RealTime/IntraDay
- VectorVest AutoTester
- VectorVest Educational Services
- VectorVest OnLine
- VectorVest Options Analyzer
- VectorVest ProGraphics v6.0
- VectorVest ProTrader 7
- VectorVest RealTime Derby Tool
- VectorVest Simulator
- VectorVest Variator
- VectorVest Watchdog
- StockCharts.com, Inc.
- Candle Patterns
- Candlestick Charting Explained
- Intermarket Technical Analysis
- John Murphy on Chart Analysis
- John Murphy's Chart Pattern Recognition
- John Murphy's Market Message
- MurphyExplainsMarketAnalysis-Intermarket Analysis
- MurphyExplainsMarketAnalysis-Visual Analysis
- StockCharts.com
- Technical Analysis of the Financial Markets
- The Visual Investor
