HOT TOPICS LIST
- MACD
- Fibonacci
- RSI
- Gann
- ADXR
- Stochastics
- Volume
- Triangles
- Futures
- Cycles
- Volatility
- ZIGZAG
- MESA
- Retracement
- Aroon
INDICATORS LIST
LIST OF TOPICS
PRINT THIS ARTICLE
by Mike Carr, CMT
Technical analysis is based on the idea that history tends to repeat itself and shows up as similar patterns in charts. Other commodities have acted like silver, and their charts may help navigate this current bubble.
Position: Sell
Mike Carr, CMT
Mike Carr, CMT, is a member of the Market Technicians Association, and editor of the MTA's newsletter, Technically Speaking. He is also the author of "Smarter Investing in Any Economy: The Definitive Guide to Relative Strength Investing," and "Conquering the Divide: How to Use Economic Indicators to Catch Stock Market Trends."
PRINT THIS ARTICLE
RATE CHANGE - PRICE
Learning From The Past With Silver
04/27/11 08:35:43 AMby Mike Carr, CMT
Technical analysis is based on the idea that history tends to repeat itself and shows up as similar patterns in charts. Other commodities have acted like silver, and their charts may help navigate this current bubble.
Position: Sell
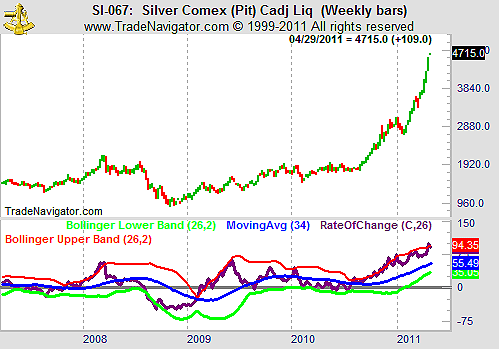
| Silver is still bubbling, and no one knows when it will stop. We see in Figure 1 that the 26-week rate of change (ROC) indicator has broken below the upper Bollinger band after being above it for only one week. This is the third time we've seen that indicator become oversold this year, and the break back below the upper band has indicated the end of a bull move in several other commodities. |

|
| FIGURE 1: SI, WEEKLY. Silver’s ROC has broken below the upper Bollinger band of that indicator. |
| Graphic provided by: Trade Navigator. |
| |
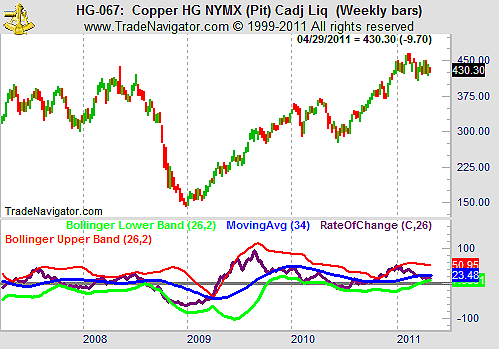
| In Figure 2, we see that copper began an extraordinary move higher in 2009. After the ROC fell back below the upper Bollinger band, the price gains slowed, only to be followed by another surge in late 2010, and now copper is trading in a consolidation that may have bearish implications. |

|
| FIGURE 2: HG, WEEKLY. In 2009, and again in late 2010, copper showed bubble-like behavior. |
| Graphic provided by: Trade Navigator. |
| |
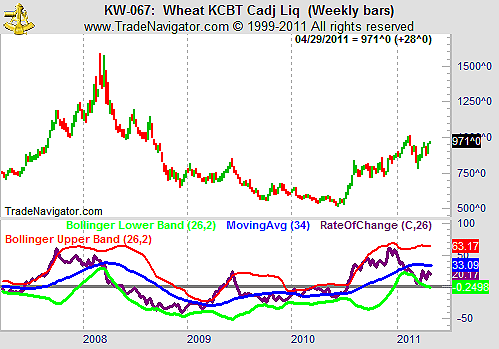
| Food prices also surged in 2010, as wheat shows in Figure 3. Breaks of the upper band in 2009 and in late 2010 coincided with tops, and buyers at that time were disappointed with the short-term price action that followed. |

|
| FIGURE 3: KW, WEEKLY. Wheat prices offer another example of rapidly increasing prices. |
| Graphic provided by: Trade Navigator. |
| |
| Using history as a guide, we can safely confirm the insight of economist John Maynard Keynes that markets can stay irrational far longer than a trader can stay solvent. However, the majority of gains are usually made before everyone is bullish. While the recent break in ROC may not be a signal to short silver, the time to be a buyer may very well be past. |
Mike Carr, CMT, is a member of the Market Technicians Association, and editor of the MTA's newsletter, Technically Speaking. He is also the author of "Smarter Investing in Any Economy: The Definitive Guide to Relative Strength Investing," and "Conquering the Divide: How to Use Economic Indicators to Catch Stock Market Trends."
| Website: | www.moneynews.com/blogs/MichaelCarr/id-73 |
| E-mail address: | marketstrategist@gmail.com |
Click here for more information about our publications!
PRINT THIS ARTICLE

Request Information From Our Sponsors
- StockCharts.com, Inc.
- Candle Patterns
- Candlestick Charting Explained
- Intermarket Technical Analysis
- John Murphy on Chart Analysis
- John Murphy's Chart Pattern Recognition
- John Murphy's Market Message
- MurphyExplainsMarketAnalysis-Intermarket Analysis
- MurphyExplainsMarketAnalysis-Visual Analysis
- StockCharts.com
- Technical Analysis of the Financial Markets
- The Visual Investor
- VectorVest, Inc.
- Executive Premier Workshop
- One-Day Options Course
- OptionsPro
- Retirement Income Workshop
- Sure-Fire Trading Systems (VectorVest, Inc.)
- Trading as a Business Workshop
- VectorVest 7 EOD
- VectorVest 7 RealTime/IntraDay
- VectorVest AutoTester
- VectorVest Educational Services
- VectorVest OnLine
- VectorVest Options Analyzer
- VectorVest ProGraphics v6.0
- VectorVest ProTrader 7
- VectorVest RealTime Derby Tool
- VectorVest Simulator
- VectorVest Variator
- VectorVest Watchdog
