HOT TOPICS LIST
- MACD
- Fibonacci
- RSI
- Gann
- ADXR
- Stochastics
- Volume
- Triangles
- Futures
- Cycles
- Volatility
- ZIGZAG
- MESA
- Retracement
- Aroon
INDICATORS LIST
LIST OF TOPICS
PRINT THIS ARTICLE
by Billy Williams
Trend trading is the most reliable way to make money, and using these three tips can help you spot them.
Position: Hold
Billy Williams
Billy Williams has been trading the markets for 27 years, specializing in momentum trading with stocks and options.
PRINT THIS ARTICLE
TECHNICAL ANALYSIS
Three Tips For Trend Identification
04/27/11 08:29:42 AMby Billy Williams
Trend trading is the most reliable way to make money, and using these three tips can help you spot them.
Position: Hold
| Sit down on your couch at any time during the 24-hour news cycle, and you'll find no shortage of pundits, analysts, or market forecasters when asked about their predictions for the market or the latest stocks ready to capitalize on their confident projections. The problem with those projections is that the farther you go in predicting the future movement of the Dow Jones Industrial Average (DJIA) or markets as a whole, the tougher it will be to be right. Black swan events alter the health and direction of markets at frightening speed and you only have to consider the effects of Hurricane Katrina, the attacks on 9-11, and the effects of the London subway attacks a few years ago in order to realize that events that had been inconceivable can now derail any stock's trend, no matter how fiscally sound the underlying company may be. Even companies that are wildly praised and followed by investors can have one bad earning report or one scandalous rumor to cause a stock to plummet (a recent example: a rumor that Taco Bell was using less than whole beef that later found out to be untrue -- it had a huge effect on the brand of that company as well as faith by the market itself). |
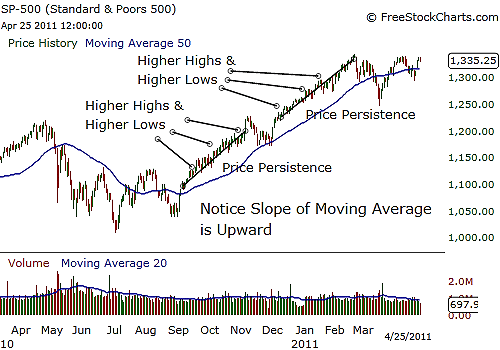
| That is why, as a trader, you must focus on what price is doing in the present, not with some future bias you might have or a tip you've picked up from a newsletter. That said, there are many fine minds that have the ability to pick winning stocks the way that George Soros or Warren Buffett do, but even these prodigies in the investment world have been known to be wrong at times. While you can act on a low-risk idea about a given investment, you must be able to spot relevant price action that confirms that low-risk idea and identify the trend in play in order to both profit and control risk by exiting the position if the trend fails to confirm the validity of the idea that made you consider trading it to begin with. See Figure 1. |

|
| FIGURE 1: S&P 500. The S&P reveals two very strong trends within the current bull run with a combination of a upsloping 50-day simple moving average, higher highs combined with higher lows being made, and price persistence in the price action. |
| Graphic provided by: www.freestockcharts.com. |
| |
| There are three things to look for when trying to identify a trend: trend qualifiers, slope of moving averages, and price persistency. Trend qualifiers, for example, in a bullish trend, are price bars that trade upward while making successive higher highs and higher lows. This type of price action shows that there is congruency between the traders in a stock and the trend itself, revealing that buyers are in control of the upward direction of the stock. Overlaying a combination of moving averages on the stock's price chart will help filter out the noise of daily price movements, showing you a smooth line that will slope upward showing a bullish trend, downward showing a bearish trend, or down the middle, revealing a trading range. The slope of the moving average acts as a visual reference to the path the stock's price action will likely take. |
| Finally, watch for price consistency where there is a steady succession of price bars trading in a given direction. By scanning price charts, you will spot times when a stock is trading with conviction to the point where you could draw a straight line through a great many price bars, which could show the persistent push in the direction of a primary trend in play. Using these three methods to identify trends will help you find the direction you should be trading in real time without being dependent on long-range forecasts that are susceptible to explosive events around that world that can leave you overexposed to risk. |
Billy Williams has been trading the markets for 27 years, specializing in momentum trading with stocks and options.
| Company: | StockOptionSystem.com |
| E-mail address: | stockoptionsystem.com@gmail.com |
Traders' Resource Links | |
| StockOptionSystem.com has not added any product or service information to TRADERS' RESOURCE. | |
Click here for more information about our publications!
Comments

|

Request Information From Our Sponsors
- VectorVest, Inc.
- Executive Premier Workshop
- One-Day Options Course
- OptionsPro
- Retirement Income Workshop
- Sure-Fire Trading Systems (VectorVest, Inc.)
- Trading as a Business Workshop
- VectorVest 7 EOD
- VectorVest 7 RealTime/IntraDay
- VectorVest AutoTester
- VectorVest Educational Services
- VectorVest OnLine
- VectorVest Options Analyzer
- VectorVest ProGraphics v6.0
- VectorVest ProTrader 7
- VectorVest RealTime Derby Tool
- VectorVest Simulator
- VectorVest Variator
- VectorVest Watchdog
- StockCharts.com, Inc.
- Candle Patterns
- Candlestick Charting Explained
- Intermarket Technical Analysis
- John Murphy on Chart Analysis
- John Murphy's Chart Pattern Recognition
- John Murphy's Market Message
- MurphyExplainsMarketAnalysis-Intermarket Analysis
- MurphyExplainsMarketAnalysis-Visual Analysis
- StockCharts.com
- Technical Analysis of the Financial Markets
- The Visual Investor
