HOT TOPICS LIST
- MACD
- Fibonacci
- RSI
- Gann
- ADXR
- Stochastics
- Volume
- Triangles
- Futures
- Cycles
- Volatility
- ZIGZAG
- MESA
- Retracement
- Aroon
INDICATORS LIST
LIST OF TOPICS
PRINT THIS ARTICLE
by Billy Williams
In a sea of equity, it can be next to impossible to spot which stock is about to take off, but using a few simple guidelines can help you spot a stock on the move.
Position: Hold
Billy Williams
Billy Williams has been trading the markets for 27 years, specializing in momentum trading with stocks and options.
PRINT THIS ARTICLE
TECHNICAL ANALYSIS
Trading Stocks With Daylight
04/26/11 08:28:13 AMby Billy Williams
In a sea of equity, it can be next to impossible to spot which stock is about to take off, but using a few simple guidelines can help you spot a stock on the move.
Position: Hold
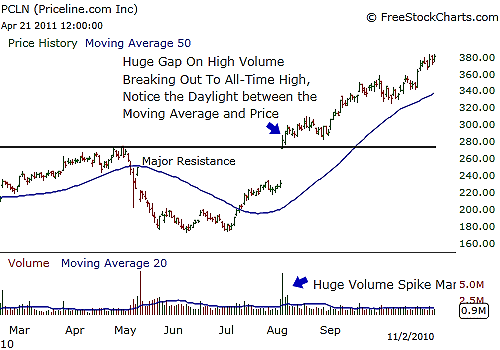
| Watching a sea of stock charts, you hope to find that one special company, that one special stock whose price action stands out from the vast ocean of stocks trading around the world at the touch of a computer keyboard, that makes you believe that it has the potential to take off -- either in a bullish trend or bearish trend -- and yield a profit. However, if you have traded for any length of time, you know what appears to be one of the gifted stocks that appear to be ready to take off. You also have a degree of cynicism at the same time as well, since so many stocks fail to rise beyond their support and resistance lines and crash in the opposite of the direction you had originally hoped for. You know that stocks go through periods of expansion and contraction, trending and being range-bound, but how do you spot when a move is about to make a runaway without falling for a false move that chips away at your trading account, one tiny loss at a time? But stocks leave clues, particularly stocks that have the potential to rise beyond their contracted price patterns and expand to form steady to explosive trends, if you know what to look for and devise a method to help you filter the chaff from the wheat of successful stockpicking. See Figure 1. |

|
| FIGURE 1: PCLN. PCLN had major resistance to trade through but once it did, you saw the stock pull away from an upsloping 50-day MA, showing buyers were in control of the stock, pushing it higher. |
| Graphic provided by: www.freestockcharts.com. |
| |
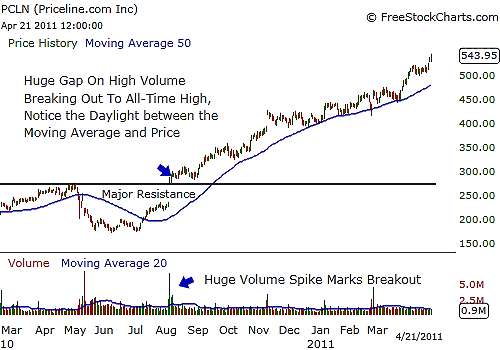
| There are two key tools -- moving averages and the daylight concept -- that you can use to help you spot moves in stocks that have potential while avoiding the stocks that are just oscillating back and forth in their price action that makes no real commitment to expanding in any given direction. Moving averages are derivatives of their underlying price action and offer a visual reference as to the path that a stock is trading. They are lagging indicators that reveal a smooth direction in a stock's trend without any of the whipsawing price action that can occur on a price chart itself. Moving averages reveal the direction of a stock by rising above the volatile price action that can occur in real time, showing the slope of the stock's trajectory itself. See Figure 2. |

|
| FIGURE 2: PCLN. Once PCLN pulled away from its 50-day MA, it rocketed higher and only touched the MA as support while continuing upward. |
| Graphic provided by: www.freestockcharts.com. |
| |
| The daylight concept is detailed in Dave Landry's book, "The Layman's Guide To Trading Stocks," which shows when a stock's price is pulling away from the moving average. For uptrends, the moving average should be pointing upward while price itself pulls away in a bullish trend from the moving average on strong buying by traders and investors alike. For downtrends, the moving average should be pointing downward while price pulls away from the indicator in a bearish trend on strong selling by the market. |
| Using these two concepts with the common price action types of the market -- expansion and contraction -- when the market reverts into a tight trading range (contraction), then begins to break out of that range (expansion) you can use the slope of the stock's moving average alongside the daylight phenomenon that occurs when price pulls away from the moving average, trading in the direction indicated by the moving average, to exploit a runaway move in play. |
| The early spotting of a breakaway move helps you gain a competitive advantage by spotting the resumption of a trend or the beginning of a new trend. Use a combination of simple moving averages and exponential moving averages as well as different time periods to help you locate these openings where a trend is gathering momentum and it will help you time superior entries and your risk, as a side benefit. |
Billy Williams has been trading the markets for 27 years, specializing in momentum trading with stocks and options.
| Company: | StockOptionSystem.com |
| E-mail address: | stockoptionsystem.com@gmail.com |
Traders' Resource Links | |
| StockOptionSystem.com has not added any product or service information to TRADERS' RESOURCE. | |
Click here for more information about our publications!
Comments

Request Information From Our Sponsors
- StockCharts.com, Inc.
- Candle Patterns
- Candlestick Charting Explained
- Intermarket Technical Analysis
- John Murphy on Chart Analysis
- John Murphy's Chart Pattern Recognition
- John Murphy's Market Message
- MurphyExplainsMarketAnalysis-Intermarket Analysis
- MurphyExplainsMarketAnalysis-Visual Analysis
- StockCharts.com
- Technical Analysis of the Financial Markets
- The Visual Investor
- VectorVest, Inc.
- Executive Premier Workshop
- One-Day Options Course
- OptionsPro
- Retirement Income Workshop
- Sure-Fire Trading Systems (VectorVest, Inc.)
- Trading as a Business Workshop
- VectorVest 7 EOD
- VectorVest 7 RealTime/IntraDay
- VectorVest AutoTester
- VectorVest Educational Services
- VectorVest OnLine
- VectorVest Options Analyzer
- VectorVest ProGraphics v6.0
- VectorVest ProTrader 7
- VectorVest RealTime Derby Tool
- VectorVest Simulator
- VectorVest Variator
- VectorVest Watchdog
