

HOT TOPICS LIST
- MACD
- Fibonacci
- RSI
- Gann
- ADXR
- Stochastics
- Volume
- Triangles
- Futures
- Cycles
- Volatility
- ZIGZAG
- MESA
- Retracement
- Aroon
INDICATORS LIST
LIST OF TOPICS
PRINT THIS ARTICLE
by Gary Grosschadl
The Volatility Index (VIX) can be used as a visual tool for improving market timing.
Position: N/A
Gary Grosschadl
Independent Canadian equities trader and technical analyst based in Peterborough
Ontario, Canada.
PRINT THIS ARTICLE
VOLATILITY
VIX's One-Two Punch Timing Model
03/12/02 11:49:18 AMby Gary Grosschadl
The Volatility Index (VIX) can be used as a visual tool for improving market timing.
Position: N/A
| The Chicago Board Options Exchange Volatility Index is used by stock and options traders to monitor the market's anxiety level. It is a mathematical measure of how much the market thinks the S&P 100 index option (OEX) will fluctuate over the next 12 months based on the difference between put and call options. For contrarians, low readings for the VIX are bearish, while high readings are bullish. |
| I am not an options trader but as a very visual equities trader I use the VIX chart to show how powerful the mirror linkage is to the Nasdaq composite (or the QQQ) as a possible market direction indicator. |
|
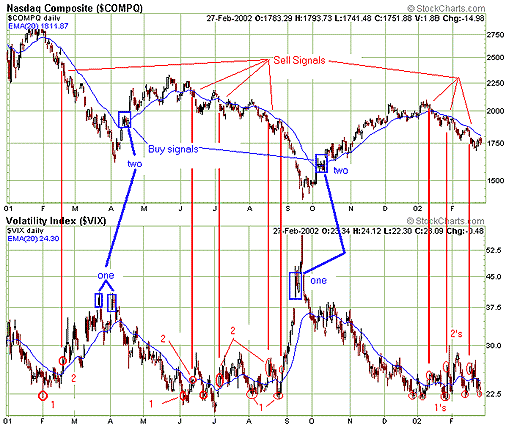
| Figure 1: Daily charts for the NASDAQ and VIX indices. A 20-day exponential moving average has been plotted on each chart. |
| Graphic provided by: Stockcharts.com. |
| |
| With a little cut-and-paste magic you can readily show this linkage by placing one chart under the other as shown. The stunning inverse relationship for this time period is unmistakable. |
| I use two buy and two sell triggers (one-two punch) to capture major market moves while avoiding whipsaw moves-- note the use of a 20-day exponential moving average (EMA). I am using VIX to generate my buy-sell signals, then checking Nasdaq for confirmation. For a sell scenario, VIX has to reach a minimum of 22.5 on the downside, and the signal is confirmed when VIX closes above its 20-day EMA. Note on the chart that the Nasdaq had weakened below its 20-day EMA at the same time, giving additional confirmation to sell. For the buy scenario, VIX has to reach a minimum 37.5 on the upside, and is confirmed when Nasdaq moves above its 20-day EMA. Notice how recent sell signals got you safely out of the market as the Nasdaq weakened below 2000 but had you correctly bullish on the prior move off the October buy signal. In the current scenario, with the Nasdaq already trading above its 20-day EMA, a further caution or confirmation is recommended before acting on a sell signal-- wait for Nasdaq to weaken below its 20-day EMA. |
| Traders may want to use this visual comparitive chart analysis tool to complement their market timing toolbox. How long will this linkage hold true? Only the market knows for sure, in the meantime the trend is your friend. |
Independent Canadian equities trader and technical analyst based in Peterborough
Ontario, Canada.
| Website: | www.whatsonsale.ca/financial.html |
| E-mail address: | gwg7@sympatico.ca |
Click here for more information about our publications!
Comments
Date:�03/12/02Rank:�5Comment:�
Date:�03/12/02Rank:�5Comment:�
Date:�03/12/02Rank:�4Comment:�
Date:�03/12/02Rank:�5Comment:�How about the volitility of other stocks? I can see the QQQs or the SPXs, but what about individual stocks? Do they have a VIX of their own? Is it historical volitility, and what measures do I use for them? Lastly, does this help with S P or Nasdaq futures?
-JB
Date:�03/14/02Rank:�4Comment:�
Date:�03/15/02Rank:�5Comment:�
Date:�03/17/02Rank:�5Comment:�
Date:�03/19/02Rank:�5Comment:�Thank you for sharing your observations...
Date:�03/19/02Rank:�4Comment:�1. The OEX/VIX represents the top 100 NYSE stocks (I thought) so why use it as a signal for the Nasdaq and not the S P.
2. You state It is a mathematical measure of how much the market thinks the S P 100 index option (OEX) will fluctuate over the next 12 months . Is the VIX not a measure of the nearby options?
Thanks, Jerry Graner jgran@sprint.ca (Toronto Metastock Users Group)
Date:�03/20/02Rank:�5Comment:�I liked the article but it was a little too basic. Is it possible that we are missing something with the VIX? How about ROC or True Strength index?
Date:�03/21/02Rank:�4Comment:�
Date:�03/26/02Rank:�4Comment:�
Date:�04/02/02Rank:�4Comment:�I sincerely hope to continue tobe able to read Mr. Grosschadl s articles on Traders.com
Date:�12/13/02Rank:�5Comment:�Expanded charts for better visualization would help.Excellent technical idea.

Request Information From Our Sponsors
- StockCharts.com, Inc.
- Candle Patterns
- Candlestick Charting Explained
- Intermarket Technical Analysis
- John Murphy on Chart Analysis
- John Murphy's Chart Pattern Recognition
- John Murphy's Market Message
- MurphyExplainsMarketAnalysis-Intermarket Analysis
- MurphyExplainsMarketAnalysis-Visual Analysis
- StockCharts.com
- Technical Analysis of the Financial Markets
- The Visual Investor
- VectorVest, Inc.
- Executive Premier Workshop
- One-Day Options Course
- OptionsPro
- Retirement Income Workshop
- Sure-Fire Trading Systems (VectorVest, Inc.)
- Trading as a Business Workshop
- VectorVest 7 EOD
- VectorVest 7 RealTime/IntraDay
- VectorVest AutoTester
- VectorVest Educational Services
- VectorVest OnLine
- VectorVest Options Analyzer
- VectorVest ProGraphics v6.0
- VectorVest ProTrader 7
- VectorVest RealTime Derby Tool
- VectorVest Simulator
- VectorVest Variator
- VectorVest Watchdog