HOT TOPICS LIST
- MACD
- Fibonacci
- RSI
- Gann
- ADXR
- Stochastics
- Volume
- Triangles
- Futures
- Cycles
- Volatility
- ZIGZAG
- MESA
- Retracement
- Aroon
INDICATORS LIST
LIST OF TOPICS
PRINT THIS ARTICLE
by Austin Passamonte
Here's a short-term outlook for the S&P 500 and Russell 2000 emini futures.
Position: N/A
Austin Passamonte
Austin is a private trader who trades emini stock index futures intraday. He currently trades various futures markets from home in addition to managing a trader's educational forum
PRINT THIS ARTICLE
TECHNICAL ANALYSIS
Doubled-Down
04/25/11 02:47:58 PMby Austin Passamonte
Here's a short-term outlook for the S&P 500 and Russell 2000 emini futures.
Position: N/A
| The April 18-21st week of trading was the expected light volume, low-range progression ahead of the Easter/Passover holiday period. Stock index markets were particularly congestive, and they left behind some glaringly obvious tells on their charts for savvy traders to exploit. |

|
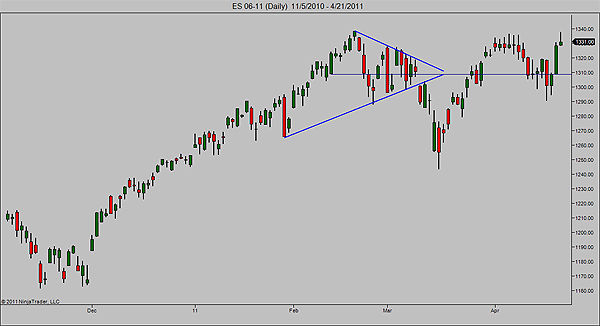
| FIGURE 1: ES, DAILY |
| Graphic provided by: NinjaTrader. |
| |
| The Standard & Poor's 500 (ES) finished the week near recent double-top congestion at the 1330s zone (Figure 1). Downside to the upside breaks of the prior wedge pattern subsequently pulled back into support and continued higher. That pivotal mark remains in play going forward in the near term. |

|
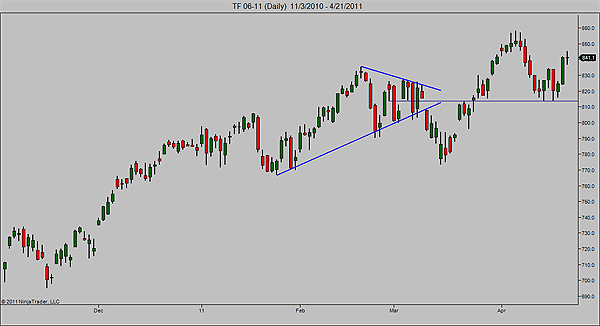
| FIGURE 2: TF, DAILY |
| Graphic provided by: NinjaTrader. |
| |
| The same pattern of behavior followed suit in TF (Figure 2). The late March/early April highs just below 860 are still a reach away above. Price did a pullback test and bounced from the wedge pattern apex. Again, that was a mark of demarcation to trade around until price broke out above recent highs. |

|
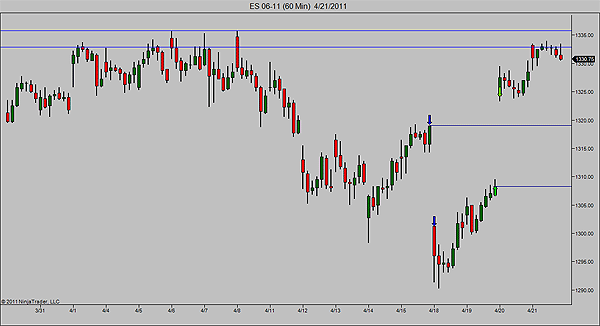
| FIGURE 3: ES, 60-MINUTE |
| Graphic provided by: NinjaTrader. |
| |
| In the process of drifting around, ES left behind two open gaps to be filled, soon (Figure 3). The Friday April 15th close to the Monday April 18th open was a moderate gap down. The Tuesday April 19th close to Wednesday April 20th open was likewise a moderate gap going the opposite way. |

|
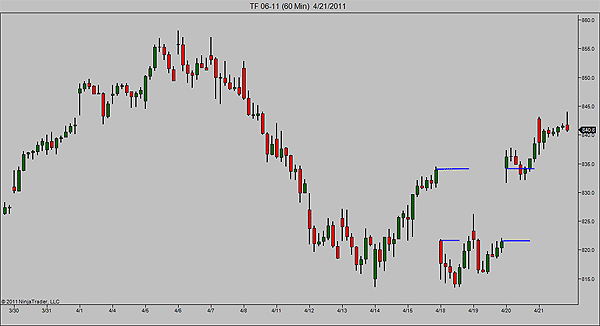
| FIGURE 4: TF, 60-MINUTE |
| Graphic provided by: NinjaTrader. |
| |
| The same behavior in TF was the case in Figure 4. A gap cannot be erased or closed by an opposing gap; that merely creates overlapped holes in a chart. We tend to see this only a couple times inside any given calendar year. What usually happens is a rapid return to fill both gaps before price action has a stable base to progress after it completes the backfill. Look for lower prices to fill the lowest gaps from the April 15th close of trading soon. |
Austin is a private trader who trades emini stock index futures intraday. He currently trades various futures markets from home in addition to managing a trader's educational forum
| Title: | Individual Trader |
| Company: | CoiledMarkets.com |
| Address: | PO Box 633 |
| Naples, NY 14512 | |
| Website: | coiledmarkets.com/blog |
| E-mail address: | austinp44@yahoo.com |
Traders' Resource Links | |
| CoiledMarkets.com has not added any product or service information to TRADERS' RESOURCE. | |
Click here for more information about our publications!
PRINT THIS ARTICLE

|

Request Information From Our Sponsors
- StockCharts.com, Inc.
- Candle Patterns
- Candlestick Charting Explained
- Intermarket Technical Analysis
- John Murphy on Chart Analysis
- John Murphy's Chart Pattern Recognition
- John Murphy's Market Message
- MurphyExplainsMarketAnalysis-Intermarket Analysis
- MurphyExplainsMarketAnalysis-Visual Analysis
- StockCharts.com
- Technical Analysis of the Financial Markets
- The Visual Investor
- VectorVest, Inc.
- Executive Premier Workshop
- One-Day Options Course
- OptionsPro
- Retirement Income Workshop
- Sure-Fire Trading Systems (VectorVest, Inc.)
- Trading as a Business Workshop
- VectorVest 7 EOD
- VectorVest 7 RealTime/IntraDay
- VectorVest AutoTester
- VectorVest Educational Services
- VectorVest OnLine
- VectorVest Options Analyzer
- VectorVest ProGraphics v6.0
- VectorVest ProTrader 7
- VectorVest RealTime Derby Tool
- VectorVest Simulator
- VectorVest Variator
- VectorVest Watchdog
