HOT TOPICS LIST
- MACD
- Fibonacci
- RSI
- Gann
- ADXR
- Stochastics
- Volume
- Triangles
- Futures
- Cycles
- Volatility
- ZIGZAG
- MESA
- Retracement
- Aroon
INDICATORS LIST
LIST OF TOPICS
PRINT THIS ARTICLE
by Koos van der Merwe
Goldman Sachs: the share price at $153.51 is enough to scare anyone away.
Position: Hold
Koos van der Merwe
Has been a technical analyst since 1969, and has worked as a futures and options trader with First Financial Futures in Johannesburg, South Africa.
PRINT THIS ARTICLE
FLAGS AND PENNANTS
Is This An Inverse Head & Shoulders Or A Flag?
04/25/11 12:41:21 PMby Koos van der Merwe
Goldman Sachs: the share price at $153.51 is enough to scare anyone away.
Position: Hold
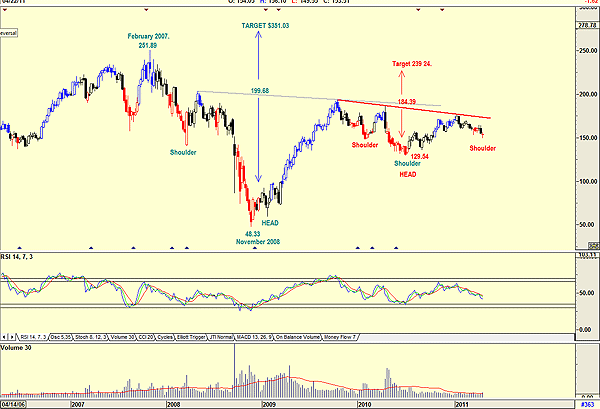
| When one looks at a weekly chart of Goldman Sachs, a very obvious inverse head & shoulders pattern seems to be developing. We all know what Goldman Sachs is: a bank that with other banks faced the stigma of bundling crummy mortgages together with good solid ones and selling them to the public as good solid mortgage-backed securities, among other things. A company whose stock price fell from a high of $251.89 in February 2007 to a low of $48.33 by November 2008 as they turned to the Federal Reserve for financial assistance. Wish I had bought the stock at that price. |

|
| FIGURE 1: GOLDMAN SACHS, WEEKLY |
| Graphic provided by: AdvancedGET. |
| |
| Figure 1 shows the inverse head & shoulders that has formed on a weekly chart, with the neckline at $199.68 suggesting a target of $351.03 (199.68 - 48.33 = 151.35 + 199.68 = 351.03). Will the share price go to that target? Perhaps not immediately, but a look at the chart does suggest that a second smaller inverse head & shoulders pattern could be developing. This is shown in red, and the target is $239.24 (184.39 - 129.54 = 54.85 + 184.39 = 239.24). Volume should start increasing as the price rises. Let us have a look at the daily chart (Figure 2). |

|
| FIGURE 2: GOLDMAN SACHS, DAILY |
| Graphic provided by: AdvancedGET. |
| |
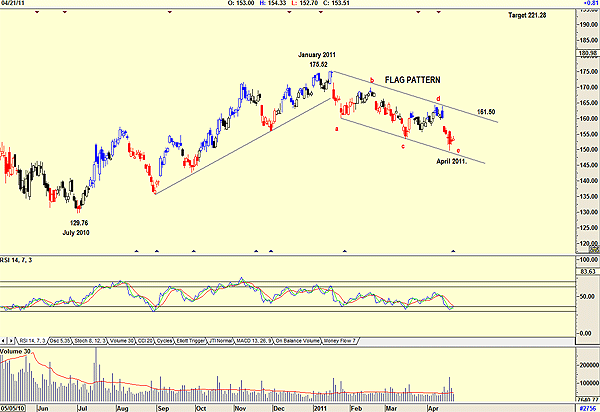
| Figure 2 does not show the inverse head & shoulders pattern. Instead, it shows a flag pattern developing. Flag patterns are true consolidation patterns and very reliable indicators both in terms of direction and measuring. They should confirm to three rules: 1. They should occur after a very sharp move up. Looking at the chart in Figure 2, one can see how the price moved up from $129.76 in July 2010 to $175.52 by January 2011. 2. Volume should decline throughout the duration of the pattern. A look at the chart shows that volume is on the whole, lower than average, with the exception of relative strength index (RSI) buy signals when volume rose. 3. Prices should break out of the pattern within a matter of a few weeks. The price has been tracing the pattern for three months now, suggesting that this may not be a flag formation. A look at the chart shows that the pattern has formed its characteristic abcde formation. The RSI is in a buy zone, suggesting that the price should now rise to test the upper trendline, probably at $161.50. Should this happen, we could expect a target of $221.28 (175.52 - 129.76 = 45.76 + 175.52 = 221.28). We now have three targets: $351.03, $239.24, and $221 28. The first two targets are weekly targets and will take weeks to achieve. The final target is a daily target and could happen within days as the market recovers. However, one should wait for a break above the upper flag trendline before buying. To conclude, one could buy the stock based on the RSI at present levels; however, it would be far safer to wait until the upper trendline of the flag pattern is broken. |
Has been a technical analyst since 1969, and has worked as a futures and options trader with First Financial Futures in Johannesburg, South Africa.
| Address: | 3256 West 24th Ave |
| Vancouver, BC | |
| Phone # for sales: | 6042634214 |
| E-mail address: | petroosp@gmail.com |
Click here for more information about our publications!
Comments

Request Information From Our Sponsors
- StockCharts.com, Inc.
- Candle Patterns
- Candlestick Charting Explained
- Intermarket Technical Analysis
- John Murphy on Chart Analysis
- John Murphy's Chart Pattern Recognition
- John Murphy's Market Message
- MurphyExplainsMarketAnalysis-Intermarket Analysis
- MurphyExplainsMarketAnalysis-Visual Analysis
- StockCharts.com
- Technical Analysis of the Financial Markets
- The Visual Investor
- VectorVest, Inc.
- Executive Premier Workshop
- One-Day Options Course
- OptionsPro
- Retirement Income Workshop
- Sure-Fire Trading Systems (VectorVest, Inc.)
- Trading as a Business Workshop
- VectorVest 7 EOD
- VectorVest 7 RealTime/IntraDay
- VectorVest AutoTester
- VectorVest Educational Services
- VectorVest OnLine
- VectorVest Options Analyzer
- VectorVest ProGraphics v6.0
- VectorVest ProTrader 7
- VectorVest RealTime Derby Tool
- VectorVest Simulator
- VectorVest Variator
- VectorVest Watchdog
