HOT TOPICS LIST
- MACD
- Fibonacci
- RSI
- Gann
- ADXR
- Stochastics
- Volume
- Triangles
- Futures
- Cycles
- Volatility
- ZIGZAG
- MESA
- Retracement
- Aroon
INDICATORS LIST
LIST OF TOPICS
PRINT THIS ARTICLE
by Donald W. Pendergast, Jr.
When the broad market finally gets in gear and starts to move in concert, it's amazing how similar the chart setups look in the various stocks that fire buy signals.
Position: Buy
Donald W. Pendergast, Jr.
Donald W. Pendergast is a financial markets consultant who offers specialized services to stock brokers and high net worth individuals who seek a better bottom line for their portfolios.
PRINT THIS ARTICLE
TRADING SYSTEMS
WMB Gives Yet Another Buy Signal As Market Heats Up
04/25/11 02:28:48 PMby Donald W. Pendergast, Jr.
When the broad market finally gets in gear and starts to move in concert, it's amazing how similar the chart setups look in the various stocks that fire buy signals.
Position: Buy
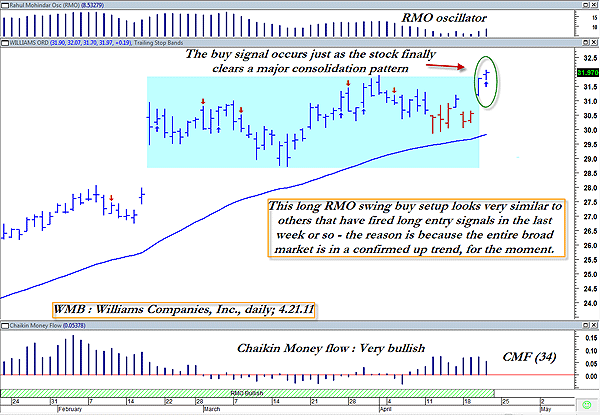
| Williams Cos. Inc. (WMB) stock isn't a real barn-burner, but it is capable of making sustained trend moves every so often, and that's all a dedicated, disciplined trader and investor really needs in order to make consistent money -- a stable of stocks that can keep going for a while in either direction -- and all under the direct supervision of a proven system or methodology. Here's a look at the latest RMO swing buy signal in shares of WMB (see Figure 1). |

|
| FIGURE 1: WMB, DAILY. Sometimes, when the entire market starts moving up as a unit, the chart patterns and system buy signals all tend to exhibit similar patterns and technical characteristics. This is certainly one of those times. |
| Graphic provided by: MetaStock. |
| Graphic provided by: Rahul Mohindar RMO indicators from MetaStock 11. |
| |
| There are certain market phases when it seems like it's much easier to make money, such as when the Rahul Mohindar oscillator (RMO) swing buy/sell signals all tend to stack up on one side of the market or the other (right now, they're heavily biased to the buy side of the equation, particularly in the large-cap issues within the .SPX). In addition, when you see a plethora of RMO swing buy signals occurring in charts like the one above in which the stock is at the end of -- or is actually breaking out of -- a well-defined consolidation pattern, it's usually a good indication that the entire market has higher prices in mind over the next few weeks, if not longer. Figure 2 is so similar to the last two we examined; money flows are strong, momentum is strong and/or rising, the stocks had all generated buy signals after being in large consolidation patterns, the stocks all featured strong comparative relative strength versus the .SPX over the past calendar quarter and they're also all above their respective 50-period exponential moving averages (EMA). So, yes, WMB appears to be a low-risk buy signal, based on all of the above criteria. |

|
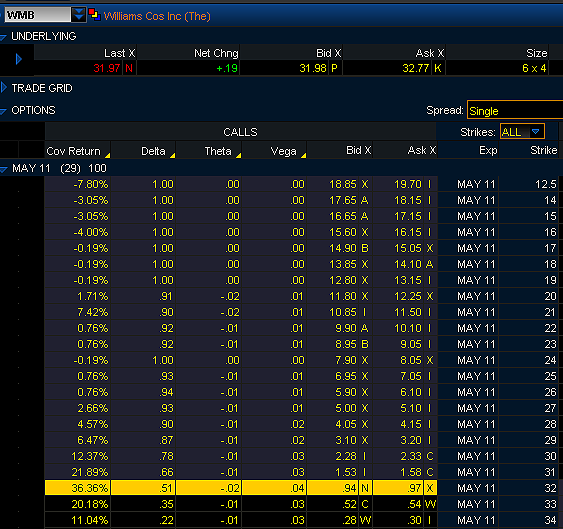
| FIGURE 2: WMB. The potential to earn a better than 30% annualized return in less than a month is a powerful lure for many covered traders, but they still need to subscribe to a strict risk control paradigm so they don't put on too large a position relative to their account size. |
| Graphic provided by: Thinkorswim. |
| |
| Conservative traders and investors owe it to themselves to investigate the May 2011 $32 covered call in WMB -- if the shares are called away at options expiration, the trade will earn better than 30% annualized for only a one-month commitment of time and capital. Bid-ask spreads on the May $32 call are very good in this highly liquid stock, too. Traders going this route in WMB might want to use the most recent weekly low as the fail-safe point to exit the trade on a daily close below it, should the trade fail to gain traction and head north as anticipated. Swing traders might simply go long on a buy-stop at a couple of ticks above Thursday's trigger bar at $32.07 and then running a two- to three-bar trailing stop of the daily lows until final stopout. As always, size your positions wisely, in line with your own risk tolerance and account size constraints, so you 'll be around to trade next week, next year and, hopefully, far into the future. |
Donald W. Pendergast is a financial markets consultant who offers specialized services to stock brokers and high net worth individuals who seek a better bottom line for their portfolios.
| Title: | Writer, market consultant |
| Company: | Linear Trading Systems LLC |
| Jacksonville, FL 32217 | |
| Phone # for sales: | 904-239-9564 |
| E-mail address: | lineartradingsys@gmail.com |
Traders' Resource Links | |
| Linear Trading Systems LLC has not added any product or service information to TRADERS' RESOURCE. | |
Click here for more information about our publications!
PRINT THIS ARTICLE

Request Information From Our Sponsors
- VectorVest, Inc.
- Executive Premier Workshop
- One-Day Options Course
- OptionsPro
- Retirement Income Workshop
- Sure-Fire Trading Systems (VectorVest, Inc.)
- Trading as a Business Workshop
- VectorVest 7 EOD
- VectorVest 7 RealTime/IntraDay
- VectorVest AutoTester
- VectorVest Educational Services
- VectorVest OnLine
- VectorVest Options Analyzer
- VectorVest ProGraphics v6.0
- VectorVest ProTrader 7
- VectorVest RealTime Derby Tool
- VectorVest Simulator
- VectorVest Variator
- VectorVest Watchdog
- StockCharts.com, Inc.
- Candle Patterns
- Candlestick Charting Explained
- Intermarket Technical Analysis
- John Murphy on Chart Analysis
- John Murphy's Chart Pattern Recognition
- John Murphy's Market Message
- MurphyExplainsMarketAnalysis-Intermarket Analysis
- MurphyExplainsMarketAnalysis-Visual Analysis
- StockCharts.com
- Technical Analysis of the Financial Markets
- The Visual Investor
