HOT TOPICS LIST
- MACD
- Fibonacci
- RSI
- Gann
- ADXR
- Stochastics
- Volume
- Triangles
- Futures
- Cycles
- Volatility
- ZIGZAG
- MESA
- Retracement
- Aroon
INDICATORS LIST
LIST OF TOPICS
PRINT THIS ARTICLE
by Chaitali Mohile
Will the index plunge to its lowest support?
Position: N/A
Chaitali Mohile
Active trader in the Indian stock markets since 2003 and a full-time writer. Trading is largely based upon technical analysis.
PRINT THIS ARTICLE
TECHNICAL ANALYSIS
Biotechnology Index On Reverse Journey
04/22/11 02:27:59 PMby Chaitali Mohile
Will the index plunge to its lowest support?
Position: N/A
| The Biotechnology Index ($BTK) underwent a long consolidation period of three months. The descending consolidation range was breached in late March 2011. After a bullish breakout, $BTK reached one more resistance at 1333 levels formed during the consolidation. We can see in Figure 1 that the index violated the upper range in the midst of the sideways movement and marked immediate resistance for the breakout rally. A huge gap up broke this resistance level, initiating a fresh bullish rally for $BTK. The bullish momentum strengthened due to the gap-up rally. Gradually, the indicators in Figure 1 surged into their bullish territories. The full stochastic (14,3,3) moved horizontally in the highly overbought region, indicating stable positive momentum. The average directional index (14) developed a fresh uptrend, and the relative strength index (RSI)(14) established support at the center line (50). Therefore, the breakout rally was very well escorted by the bulls. |

|
| FIGURE 1: $BTK, DAILY |
| Graphic provided by: StockCharts.com. |
| |
| Typically, gaps formed in any time frame always get filled. However, you cannot predict the exact time of the gap filling process; it can happen immediately or may take a longer time like a few weeks or years. In Figure 1, $BTK gained 100 points in four weeks from 1340 to 1440 levels. The gap is formed between (approximately) 1325 and 1342 levels. Therefore, it is likely that the potential bearish rally would retrace to challenge the support-resistance level formed by the gap. Currently, the overbought stochastic oscillator has slipped below 80 levels; the relative strength index (RSI)(14) is reluctant to surge above 70 levels. There is a possibility that the declining stochastic and the RSI (14) would create additional room for the current rally. |
| Here, we have to be watchful of these two oscillator levels because if they continue slipping below the bullish levels, the stable bullish rally could change its pace. Therefore, if not the current price action, any future downwards move would fill the gap in Figure 1. |

|
| FIGURE 2: $BTK, WEEKLY |
| Graphic provided by: StockCharts.com. |
| |
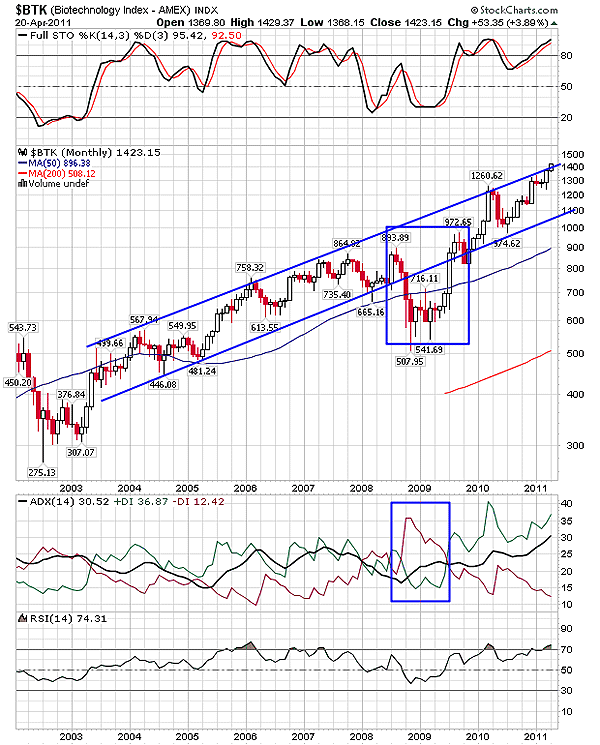
| On the monthly time frame in Figure 2, $BTK is challenging the upper trendline of an ascending channel. History shows that the index has plunged to the lower trendline from the upper trendline resistance. In fact, in 2008-09, the index breached the lower trendline support, initiating an intermediate bearish trend. The two blue boxes in Figure 2 show the bearish breakout and the developing downtrend. The record uptrend of the index was ruptured only once by the bearish breakout of the channel. However, the index regained the lost levels and resumed its bullish journey. The descending full stochastic (14,3,3) and RSI (14) reversed upward as well. |
| Will the index correct once again? All the three indicators are bullish; therefore, currently the price would not plunge. An upward breakout of the ascending channel would trigger huge buying pressure for $BTK. But if this road map fails, and the volatile global clues induced pressure, the indicators would pull down the price levels. The lower trendline would remain as strong support for the corrective rally. The descending price (within the channel in Figure 2) would automatically fill the gap formed on the daily time frame in Figure 1. |
Active trader in the Indian stock markets since 2003 and a full-time writer. Trading is largely based upon technical analysis.
| Company: | Independent |
| Address: | C1/3 Parth Indraprasth Towers. Vastrapur |
| Ahmedabad, Guj 380015 | |
| E-mail address: | chaitalimohile@yahoo.co.in |
Traders' Resource Links | |
| Independent has not added any product or service information to TRADERS' RESOURCE. | |
Click here for more information about our publications!
Comments

Request Information From Our Sponsors
- StockCharts.com, Inc.
- Candle Patterns
- Candlestick Charting Explained
- Intermarket Technical Analysis
- John Murphy on Chart Analysis
- John Murphy's Chart Pattern Recognition
- John Murphy's Market Message
- MurphyExplainsMarketAnalysis-Intermarket Analysis
- MurphyExplainsMarketAnalysis-Visual Analysis
- StockCharts.com
- Technical Analysis of the Financial Markets
- The Visual Investor
- VectorVest, Inc.
- Executive Premier Workshop
- One-Day Options Course
- OptionsPro
- Retirement Income Workshop
- Sure-Fire Trading Systems (VectorVest, Inc.)
- Trading as a Business Workshop
- VectorVest 7 EOD
- VectorVest 7 RealTime/IntraDay
- VectorVest AutoTester
- VectorVest Educational Services
- VectorVest OnLine
- VectorVest Options Analyzer
- VectorVest ProGraphics v6.0
- VectorVest ProTrader 7
- VectorVest RealTime Derby Tool
- VectorVest Simulator
- VectorVest Variator
- VectorVest Watchdog
