HOT TOPICS LIST
- MACD
- Fibonacci
- RSI
- Gann
- ADXR
- Stochastics
- Volume
- Triangles
- Futures
- Cycles
- Volatility
- ZIGZAG
- MESA
- Retracement
- Aroon
INDICATORS LIST
LIST OF TOPICS
PRINT THIS ARTICLE
by Matt Blackman
On April 18, SPY exhibited a bearish head & shoulders top pattern on the hourly chart. It's been invalidated since then. What does this mean?
Position: N/A
Matt Blackman
Matt Blackman is a full-time technical and financial writer and trader. He produces corporate and financial newsletters, and assists clients in getting published in the mainstream media. He is the host of TradeSystemGuru.com. Matt has earned the Chartered Market Technician (CMT) designation. Find out what stocks and futures Matt is watching on Twitter at www.twitter.com/RatioTrade
PRINT THIS ARTICLE
HEAD & SHOULDERS
SPY Head & Shoulder Failure
04/22/11 08:03:24 AMby Matt Blackman
On April 18, SPY exhibited a bearish head & shoulders top pattern on the hourly chart. It's been invalidated since then. What does this mean?
Position: N/A
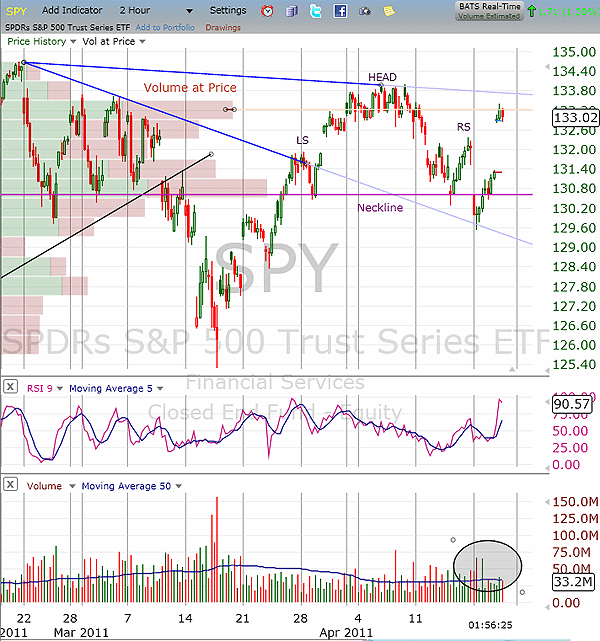
| In my Traders.com Advantage article "Another Bearish Sign on SPY?," I discussed the definite bearish head & shoulders top pattern with a breach of the neckline through a gap that made the pattern more bearish on the April 18th hourly chart. However, in the two days after the breach, something happened (Figure 1). |

|
| FIGURE 1: SPY. Two-hour chart of the S&P 500 Trust ETF showing head & shoulders top failure. |
| Graphic provided by: http://www.freestockcharts.com/. |
| |
| SPY not only broke up through the H&S neckline on April 19, the stock gapped up more than 1.2% April 20 on positive earnings and higher inflation expectations. The good news for bulls is that the bearish scenario on the short-term breach of the neckline was invalidated. |
| For proactive traders, a chart pattern failure is as good a signal as a confirmation. It broadcasts that its time to become bullish has again been confirmed. However, the SPY upside gap on April 20 will need to be tested and the volume at price resistance level at 133.30 will need to be decisively broken on above-average volume before this author would consider making a bullish bet. |
| The moral is that patterns in short time frames have very short-term implications. With reversal patterns like the head & shoulder, the longer time frames like daily and weekly are more reliable in signaling a market reversal. And like all patterns, confirmation is key. |
Matt Blackman is a full-time technical and financial writer and trader. He produces corporate and financial newsletters, and assists clients in getting published in the mainstream media. He is the host of TradeSystemGuru.com. Matt has earned the Chartered Market Technician (CMT) designation. Find out what stocks and futures Matt is watching on Twitter at www.twitter.com/RatioTrade
| Company: | TradeSystemGuru.com |
| Address: | Box 2589 |
| Garibaldi Highlands, BC Canada | |
| Phone # for sales: | 604-898-9069 |
| Fax: | 604-898-9069 |
| Website: | www.tradesystemguru.com |
| E-mail address: | indextradermb@gmail.com |
Traders' Resource Links | |
| TradeSystemGuru.com has not added any product or service information to TRADERS' RESOURCE. | |
Click here for more information about our publications!
PRINT THIS ARTICLE

|

Request Information From Our Sponsors
- StockCharts.com, Inc.
- Candle Patterns
- Candlestick Charting Explained
- Intermarket Technical Analysis
- John Murphy on Chart Analysis
- John Murphy's Chart Pattern Recognition
- John Murphy's Market Message
- MurphyExplainsMarketAnalysis-Intermarket Analysis
- MurphyExplainsMarketAnalysis-Visual Analysis
- StockCharts.com
- Technical Analysis of the Financial Markets
- The Visual Investor
- VectorVest, Inc.
- Executive Premier Workshop
- One-Day Options Course
- OptionsPro
- Retirement Income Workshop
- Sure-Fire Trading Systems (VectorVest, Inc.)
- Trading as a Business Workshop
- VectorVest 7 EOD
- VectorVest 7 RealTime/IntraDay
- VectorVest AutoTester
- VectorVest Educational Services
- VectorVest OnLine
- VectorVest Options Analyzer
- VectorVest ProGraphics v6.0
- VectorVest ProTrader 7
- VectorVest RealTime Derby Tool
- VectorVest Simulator
- VectorVest Variator
- VectorVest Watchdog
