HOT TOPICS LIST
- MACD
- Fibonacci
- RSI
- Gann
- ADXR
- Stochastics
- Volume
- Triangles
- Futures
- Cycles
- Volatility
- ZIGZAG
- MESA
- Retracement
- Aroon
INDICATORS LIST
LIST OF TOPICS
PRINT THIS ARTICLE
by David Penn
With the CRB Index going parabolic, May soybeans look to break out from a five-month bottom.
Position: N/A
David Penn
Technical Writer for Technical Analysis of STOCKS & COMMODITIES magazine, Working-Money.com, and Traders.com Advantage.
PRINT THIS ARTICLE
HEAD & SHOULDERS
A Head and Shoulders Bottom in Beans
03/11/02 01:39:25 PMby David Penn
With the CRB Index going parabolic, May soybeans look to break out from a five-month bottom.
Position: N/A
| Back near the end of January, I wondered whether or not the secondary correction in the commodities bear market was in fact a secondary correction ("More on the Dollar and Commodities", January 25, 2002. Traders.com Advantage). The alternative, of course, was that rather than being a secondary correction, the CRB Index was embarking upon a new bull journey. While the jury may still be out on whether or not a new bull market in commodities is beginning, the signals from the CRB--as well as from individual commodities such as crude oil ("Light Crude Tests Rally Top," March 1, 2002. Traders.com Advantage)--suggest that the current move in commodities is a significant one. |
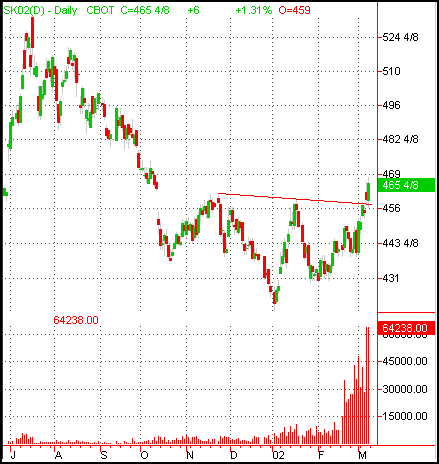
| Another commodity that looks to be showing strength is soybeans. Soybeans have been in decline since July 2001 when they traded just shy of 550. Six months later, soybeans--as measured by the May 2002 contract--were at about 420, a decline of almost 24%. This point was reached at the very end of December 2001, and now appears to be part of a major, five-month bottoming process in soybeans. This process looks to have begun with the declines following the gap down in October 2001. |

|
| A high-volume breakout from this head and shoulders bottom could mark the acceleration of an emergent bull trend. |
| Graphic provided by: TradeStation. |
| |
| The bottoming process, as I have labeled it, resembles a head and shoulders bottom. The October decline mentioned above and the subsequent late October/early November rally looks to represent the left shoulder of the formation. The decline from that rally, a decline that began in the second half of November, bottomed in late December and rallied into January--forming the head of the head and shoulders bottom. Lastly, the declines in the second half of January and the subsequent rally in February and March complete the right shoulder of the formation. The continued rally in March, in fact, looks to be leading an upside breakout from the pattern, with particularly high-volume on the day following the breakout day. |
| What does the pattern suggest about the extent of an upside move? From the trough low in the "head" of the formation to the neckline--is about 40 points. Adding this number to the value at the neckline (460) provides for an upside target of 500. Such an advance would likely include a test of the August and September 2001 highs. |
Technical Writer for Technical Analysis of STOCKS & COMMODITIES magazine, Working-Money.com, and Traders.com Advantage.
| Title: | Technical Writer |
| Company: | Technical Analysis, Inc. |
| Address: | 4757 California Avenue SW |
| Seattle, WA 98116 | |
| Phone # for sales: | 206 938 0570 |
| Fax: | 206 938 1307 |
| Website: | www.Traders.com |
| E-mail address: | DPenn@traders.com |
Traders' Resource Links | |
| Charting the Stock Market: The Wyckoff Method -- Books | |
| Working-Money.com -- Online Trading Services | |
| Traders.com Advantage -- Online Trading Services | |
| Technical Analysis of Stocks & Commodities -- Publications and Newsletters | |
| Working Money, at Working-Money.com -- Publications and Newsletters | |
| Traders.com Advantage -- Publications and Newsletters | |
| Professional Traders Starter Kit -- Software | |
Click here for more information about our publications!
PRINT THIS ARTICLE

Request Information From Our Sponsors
- StockCharts.com, Inc.
- Candle Patterns
- Candlestick Charting Explained
- Intermarket Technical Analysis
- John Murphy on Chart Analysis
- John Murphy's Chart Pattern Recognition
- John Murphy's Market Message
- MurphyExplainsMarketAnalysis-Intermarket Analysis
- MurphyExplainsMarketAnalysis-Visual Analysis
- StockCharts.com
- Technical Analysis of the Financial Markets
- The Visual Investor
- VectorVest, Inc.
- Executive Premier Workshop
- One-Day Options Course
- OptionsPro
- Retirement Income Workshop
- Sure-Fire Trading Systems (VectorVest, Inc.)
- Trading as a Business Workshop
- VectorVest 7 EOD
- VectorVest 7 RealTime/IntraDay
- VectorVest AutoTester
- VectorVest Educational Services
- VectorVest OnLine
- VectorVest Options Analyzer
- VectorVest ProGraphics v6.0
- VectorVest ProTrader 7
- VectorVest RealTime Derby Tool
- VectorVest Simulator
- VectorVest Variator
- VectorVest Watchdog
