HOT TOPICS LIST
- MACD
- Fibonacci
- RSI
- Gann
- ADXR
- Stochastics
- Volume
- Triangles
- Futures
- Cycles
- Volatility
- ZIGZAG
- MESA
- Retracement
- Aroon
INDICATORS LIST
LIST OF TOPICS
PRINT THIS ARTICLE
by Koos van der Merwe
A trend may be interrupted and move sideways for a time before continuing its previous direction.
Position: Sell
Koos van der Merwe
Has been a technical analyst since 1969, and has worked as a futures and options trader with First Financial Futures in Johannesburg, South Africa.
PRINT THIS ARTICLE
TRIANGLES
Analyzing A Triangle
04/21/11 08:27:46 AMby Koos van der Merwe
A trend may be interrupted and move sideways for a time before continuing its previous direction.
Position: Sell
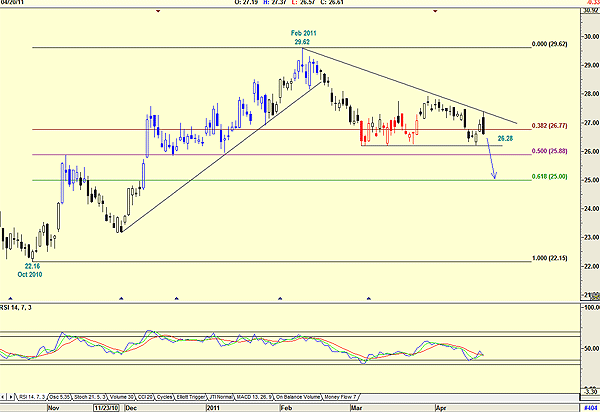
| Sideway movements in a trendline where the trendline is broken is known as a consolidation or continuation pattern, the most common being a triangle. Triangles form as a result of indecision by both buyers and sellers. Market participants tend to withdraw to the sidelines, causing narrower market fluctuations and less volume. A breakout usually occurs when news affecting the stock or the market as a whole occurs, and is usually accompanied by a sharp increase in volume. This happens with a symmetrical triangle. When one of the triangle trendlines is horizontal, however, we get a triangle known as a right angle triangle. When the upper line is horizontal and the lower line is sloping upward, demand is growing, and a break above the horizontal line will occur as buyers enter the market. However, when the upper line is falling and the lower line is horizontal, this is an indication that there is demand at a fixed price, but supply continues to come into the market. Eventually, demand is exhausted, and the price will break out of the triangle to the downside. This is what is happening to BB&T Corp. (BBT) as shown in Figure 1. |

|
| FIGURE 1: BBT, DAILY |
| Graphic provided by: AdvancedGET. |
| |
| The stock price moved from a low of $22.16 in October 2010 to a high of $29.62 by February 2011, and then fell to form a support level at $26.28. This support level has turned into a horizontal line of a descending right angle triangle, suggesting weakness, even though the relative strength index (RSI) shown on the chart is suggesting strength. How low can the fall be? Try drawing a Fibonacci retracement as shown. The reversal point could be at any of the levels shown, with the 61.8% level of $25 being the most likely. Triangles are very important as an indication of trend direction and should never be ignored. |
Has been a technical analyst since 1969, and has worked as a futures and options trader with First Financial Futures in Johannesburg, South Africa.
| Address: | 3256 West 24th Ave |
| Vancouver, BC | |
| Phone # for sales: | 6042634214 |
| E-mail address: | petroosp@gmail.com |
Click here for more information about our publications!
Comments

Request Information From Our Sponsors
- StockCharts.com, Inc.
- Candle Patterns
- Candlestick Charting Explained
- Intermarket Technical Analysis
- John Murphy on Chart Analysis
- John Murphy's Chart Pattern Recognition
- John Murphy's Market Message
- MurphyExplainsMarketAnalysis-Intermarket Analysis
- MurphyExplainsMarketAnalysis-Visual Analysis
- StockCharts.com
- Technical Analysis of the Financial Markets
- The Visual Investor
- VectorVest, Inc.
- Executive Premier Workshop
- One-Day Options Course
- OptionsPro
- Retirement Income Workshop
- Sure-Fire Trading Systems (VectorVest, Inc.)
- Trading as a Business Workshop
- VectorVest 7 EOD
- VectorVest 7 RealTime/IntraDay
- VectorVest AutoTester
- VectorVest Educational Services
- VectorVest OnLine
- VectorVest Options Analyzer
- VectorVest ProGraphics v6.0
- VectorVest ProTrader 7
- VectorVest RealTime Derby Tool
- VectorVest Simulator
- VectorVest Variator
- VectorVest Watchdog
