HOT TOPICS LIST
- MACD
- Fibonacci
- RSI
- Gann
- ADXR
- Stochastics
- Volume
- Triangles
- Futures
- Cycles
- Volatility
- ZIGZAG
- MESA
- Retracement
- Aroon
INDICATORS LIST
LIST OF TOPICS
PRINT THIS ARTICLE
by Mike Carr, CMT
Recent action in silver makes the 1980 bubble top seem like rational exuberance.
Position: Hold
Mike Carr, CMT
Mike Carr, CMT, is a member of the Market Technicians Association, and editor of the MTA's newsletter, Technically Speaking. He is also the author of "Smarter Investing in Any Economy: The Definitive Guide to Relative Strength Investing," and "Conquering the Divide: How to Use Economic Indicators to Catch Stock Market Trends."
PRINT THIS ARTICLE
RATE CHANGE - PRICE
Bubble Watch: Silver
04/20/11 02:23:27 PMby Mike Carr, CMT
Recent action in silver makes the 1980 bubble top seem like rational exuberance.
Position: Hold
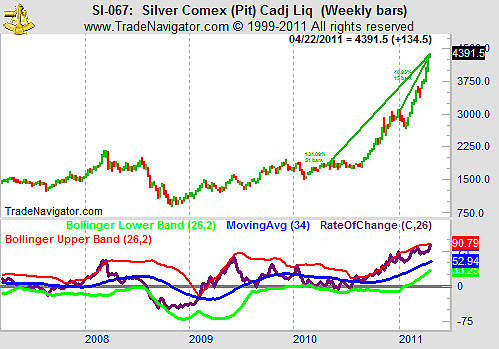
| Since the start of 2011, silver has gained more than 40%; in the past 12 months, it is up more than 130%. Traders love to call tops and bottoms but few succeed, so rather than making a strict top call, let's use the chart to look for future warning signs. |
| John Maynard Keynes was an economist and trader. One of his classic trading observations was that markets can remain irrational longer than you can remain solvent. Internet stocks defied short sellers for months before the bubble broke in spring 2000, and this spring season has seen a similar drive higher in silver. The gains may not be justified by the fundamentals, assuming anyone is actually trading on the fundamentals of silver. But technicians need to follow price action rather than arguments about whether something is too high or too low. |
| While the gains have been rapid this year, the rate of change has not decisively broken through its upper Bollinger band (Figure 1). This would be an indication of a bubble top. |

|
| FIGURE 1: SILVER, WEEKLY. The rate of change of the price of silver has not really been relatively strong. |
| Graphic provided by: Trade Navigator. |
| |
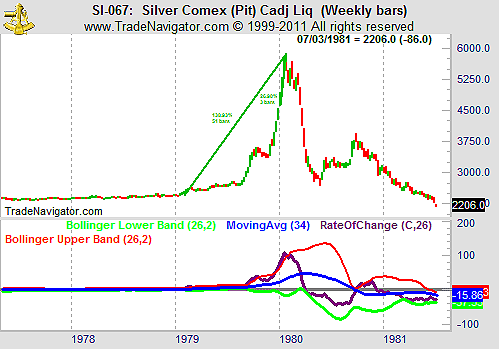
| Silver did experience a bubble at least once in its trading history, in 1980 (Figure 2). The gains were similar on a percentage basis, with silver adding about 130% in the year before the top. But that time, the rate of change (ROC) did break above the upper Bollinger band and stayed there for five weeks. A break to the downside signaled the end of the bull run and prices collapsed after that. |

|
| FIGURE 2: SILVER, WEEKLY. Silver’s rise in 1980 offers a historical perspective on a bubble in this market. |
| Graphic provided by: Trade Navigator. |
| |
| If history repeats, that could be the sell signal for silver. In any event, watching the ROC will help traders decide whether it is time to take profits in silver. |
Mike Carr, CMT, is a member of the Market Technicians Association, and editor of the MTA's newsletter, Technically Speaking. He is also the author of "Smarter Investing in Any Economy: The Definitive Guide to Relative Strength Investing," and "Conquering the Divide: How to Use Economic Indicators to Catch Stock Market Trends."
| Website: | www.moneynews.com/blogs/MichaelCarr/id-73 |
| E-mail address: | marketstrategist@gmail.com |
Click here for more information about our publications!
PRINT THIS ARTICLE

Request Information From Our Sponsors
- StockCharts.com, Inc.
- Candle Patterns
- Candlestick Charting Explained
- Intermarket Technical Analysis
- John Murphy on Chart Analysis
- John Murphy's Chart Pattern Recognition
- John Murphy's Market Message
- MurphyExplainsMarketAnalysis-Intermarket Analysis
- MurphyExplainsMarketAnalysis-Visual Analysis
- StockCharts.com
- Technical Analysis of the Financial Markets
- The Visual Investor
- VectorVest, Inc.
- Executive Premier Workshop
- One-Day Options Course
- OptionsPro
- Retirement Income Workshop
- Sure-Fire Trading Systems (VectorVest, Inc.)
- Trading as a Business Workshop
- VectorVest 7 EOD
- VectorVest 7 RealTime/IntraDay
- VectorVest AutoTester
- VectorVest Educational Services
- VectorVest OnLine
- VectorVest Options Analyzer
- VectorVest ProGraphics v6.0
- VectorVest ProTrader 7
- VectorVest RealTime Derby Tool
- VectorVest Simulator
- VectorVest Variator
- VectorVest Watchdog
