HOT TOPICS LIST
- MACD
- Fibonacci
- RSI
- Gann
- ADXR
- Stochastics
- Volume
- Triangles
- Futures
- Cycles
- Volatility
- ZIGZAG
- MESA
- Retracement
- Aroon
INDICATORS LIST
LIST OF TOPICS
PRINT THIS ARTICLE
by Mike Carr, CMT
Rate of change and sentiment are trending opposite to the price action of the S&P 500.
Position: Sell
Mike Carr, CMT
Mike Carr, CMT, is a member of the Market Technicians Association, and editor of the MTA's newsletter, Technically Speaking. He is also the author of "Smarter Investing in Any Economy: The Definitive Guide to Relative Strength Investing," and "Conquering the Divide: How to Use Economic Indicators to Catch Stock Market Trends."
PRINT THIS ARTICLE
RATE CHANGE - PRICE
Divergences In Stocks Starting To Appear
04/19/11 09:59:53 AMby Mike Carr, CMT
Rate of change and sentiment are trending opposite to the price action of the S&P 500.
Position: Sell
| Except for a brief, and scary, 7% dip, the Standard & Poor's 500 has been moving higher this year. Since bottoming in March, several notable divergences are taking place underneath the bullish price action. Divergences occur when an indicator moves opposite to price. In this example, we have indicators pointing down as prices are pointing up. |
| Rate of change (ROC) measures the momentum of price moves. One way to think of momentum is to picture a car moving down the highway. As the car gets on the road, it will accelerate to reach cruising speed, and the rate of change of the car's speed will be moving up along with its speed. Before exiting, the driver will slow down as the exit approaches and the rate of change will show a deceleration, along with the speed. |
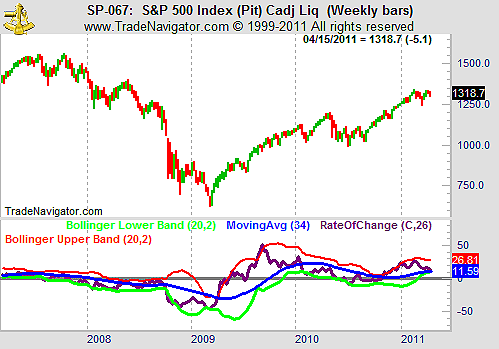
| Figure 1 shows the futures contract for the S&P 500 along with the rate of change at the bottom of the chart. As price recovered from the March lows, we can see that the ROC continued to decline. Bollinger bands help place the indicator in context, and we can see that it is now near the lower band, a level inconsistent with past bullish markets. |

|
| FIGURE 1: S&P 500, WEEKLY. ROC has failed to confirm the recent price rise, as seen on this weekly chart of the S&P 500 futures contract. |
| Graphic provided by: Trade Navigator. |
| |
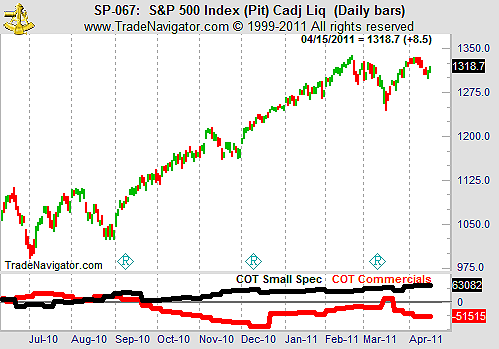
| Futures markets are useful to study, even for stock market traders. Figure 2 shows the Commitment of Traders data for the S&P 500 contract. This report tracks the actual positions held by several categories of traders in the market, and shows what real people are doing with real money. |

|
| FIGURE 2: S&P 500, DAILY. The CFTC reports on COT data and offers clues as to market turning points. |
| Graphic provided by: Trade Navigator. |
| |
| We can see that small speculators (the black line in the bottom portion of the chart) are holding more contracts than they have at any other time this year. They tend to be wrong at market turning points. Commercials, large companies that tend to be right about the trend, are increasing their short positions (the solid red line). Stocks can go higher from here, but momentum and sentiment should turn around if this is a healthy bull market. |
Mike Carr, CMT, is a member of the Market Technicians Association, and editor of the MTA's newsletter, Technically Speaking. He is also the author of "Smarter Investing in Any Economy: The Definitive Guide to Relative Strength Investing," and "Conquering the Divide: How to Use Economic Indicators to Catch Stock Market Trends."
| Website: | www.moneynews.com/blogs/MichaelCarr/id-73 |
| E-mail address: | marketstrategist@gmail.com |
Click here for more information about our publications!
PRINT THIS ARTICLE

Request Information From Our Sponsors
- StockCharts.com, Inc.
- Candle Patterns
- Candlestick Charting Explained
- Intermarket Technical Analysis
- John Murphy on Chart Analysis
- John Murphy's Chart Pattern Recognition
- John Murphy's Market Message
- MurphyExplainsMarketAnalysis-Intermarket Analysis
- MurphyExplainsMarketAnalysis-Visual Analysis
- StockCharts.com
- Technical Analysis of the Financial Markets
- The Visual Investor
- VectorVest, Inc.
- Executive Premier Workshop
- One-Day Options Course
- OptionsPro
- Retirement Income Workshop
- Sure-Fire Trading Systems (VectorVest, Inc.)
- Trading as a Business Workshop
- VectorVest 7 EOD
- VectorVest 7 RealTime/IntraDay
- VectorVest AutoTester
- VectorVest Educational Services
- VectorVest OnLine
- VectorVest Options Analyzer
- VectorVest ProGraphics v6.0
- VectorVest ProTrader 7
- VectorVest RealTime Derby Tool
- VectorVest Simulator
- VectorVest Variator
- VectorVest Watchdog
