HOT TOPICS LIST
- MACD
- Fibonacci
- RSI
- Gann
- ADXR
- Stochastics
- Volume
- Triangles
- Futures
- Cycles
- Volatility
- ZIGZAG
- MESA
- Retracement
- Aroon
INDICATORS LIST
LIST OF TOPICS
PRINT THIS ARTICLE
by Matt Blackman
Last week it was market leader Google. This week, the S&P 500 ETF SPY put in a bearish head & shoulders top pattern. Another bearish omen for US stocks?
Position: N/A
Matt Blackman
Matt Blackman is a full-time technical and financial writer and trader. He produces corporate and financial newsletters, and assists clients in getting published in the mainstream media. He is the host of TradeSystemGuru.com. Matt has earned the Chartered Market Technician (CMT) designation. Find out what stocks and futures Matt is watching on Twitter at www.twitter.com/RatioTrade
PRINT THIS ARTICLE
HEAD & SHOULDERS
Another Bearish Sign On SPY?
04/20/11 02:03:35 PMby Matt Blackman
Last week it was market leader Google. This week, the S&P 500 ETF SPY put in a bearish head & shoulders top pattern. Another bearish omen for US stocks?
Position: N/A
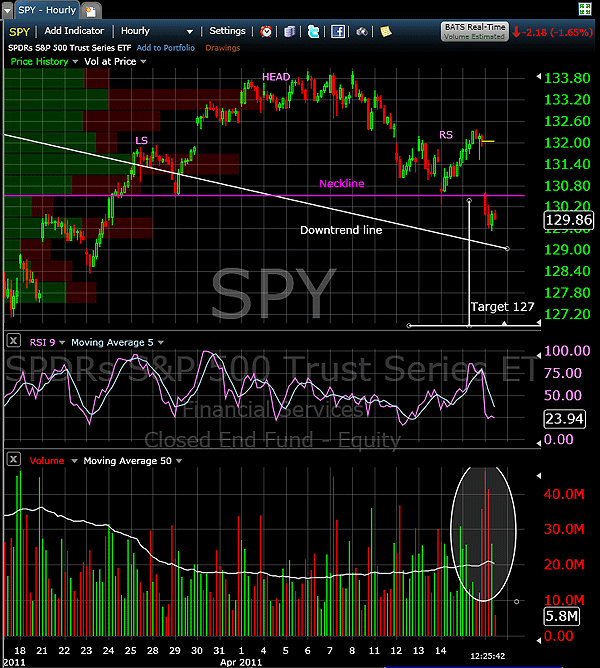
| Previously, I wrote about Google, confirming a very bearish head & shoulders top pattern as it gapped down through the neckline on heavy volume. On Monday, April 18, the market fell out of bed on news that rating agency Standard & Poor's had downgraded US debt to a "negative" outlook. Figure 1 shows how SPY responded to the news. |

|
| FIGURE 1: SPY, HOURLY. Hourly chart of SPY showing the confirmation of the bearish head & shoulders top pattern with a gap down through the neckline on April 18. |
| Graphic provided by: http://www.freestockcharts.com/. |
| |
| The next test for SPY will come on whether it can break down through the downtrend support line. But given this pattern, there is often a brief rally and attempt to break up through the neckline on lower than average volume. If this rally is successful and volume builds on the rally enough to decisively break up through the neckline, the bearish head & shoulders is invalidated. |
| But if the pattern and neckline resistance hold, traders will be looking for SPY to hit its minimum price target of 127, which is arrived at by measuring the distance from the top of the head to the neckline and subtracting from the neckline down. |
| Meanwhile, Google continued to drop on above-average selling volume, which is another bearish indicator. For more on the head & shoulder top pattern, see my article on Google. |
| For more on the head & shoulders pattern, go to http://www.chartpattern.com/head_shoulders.html |
Matt Blackman is a full-time technical and financial writer and trader. He produces corporate and financial newsletters, and assists clients in getting published in the mainstream media. He is the host of TradeSystemGuru.com. Matt has earned the Chartered Market Technician (CMT) designation. Find out what stocks and futures Matt is watching on Twitter at www.twitter.com/RatioTrade
| Company: | TradeSystemGuru.com |
| Address: | Box 2589 |
| Garibaldi Highlands, BC Canada | |
| Phone # for sales: | 604-898-9069 |
| Fax: | 604-898-9069 |
| Website: | www.tradesystemguru.com |
| E-mail address: | indextradermb@gmail.com |
Traders' Resource Links | |
| TradeSystemGuru.com has not added any product or service information to TRADERS' RESOURCE. | |
Click here for more information about our publications!
PRINT THIS ARTICLE

Request Information From Our Sponsors
- StockCharts.com, Inc.
- Candle Patterns
- Candlestick Charting Explained
- Intermarket Technical Analysis
- John Murphy on Chart Analysis
- John Murphy's Chart Pattern Recognition
- John Murphy's Market Message
- MurphyExplainsMarketAnalysis-Intermarket Analysis
- MurphyExplainsMarketAnalysis-Visual Analysis
- StockCharts.com
- Technical Analysis of the Financial Markets
- The Visual Investor
- VectorVest, Inc.
- Executive Premier Workshop
- One-Day Options Course
- OptionsPro
- Retirement Income Workshop
- Sure-Fire Trading Systems (VectorVest, Inc.)
- Trading as a Business Workshop
- VectorVest 7 EOD
- VectorVest 7 RealTime/IntraDay
- VectorVest AutoTester
- VectorVest Educational Services
- VectorVest OnLine
- VectorVest Options Analyzer
- VectorVest ProGraphics v6.0
- VectorVest ProTrader 7
- VectorVest RealTime Derby Tool
- VectorVest Simulator
- VectorVest Variator
- VectorVest Watchdog
