HOT TOPICS LIST
- MACD
- Fibonacci
- RSI
- Gann
- ADXR
- Stochastics
- Volume
- Triangles
- Futures
- Cycles
- Volatility
- ZIGZAG
- MESA
- Retracement
- Aroon
INDICATORS LIST
LIST OF TOPICS
PRINT THIS ARTICLE
by Matt Blackman
Not long after its launch in 2004, Google became a market leader. That trend remained intact through good times and bad. In 2010, it flashed a bearish head & shoulders top pattern that failed to hit the target, but it was a good trade nonetheless. It's just flashed another H&S sell signal, and this one looks more promising.
Position: N/A
Matt Blackman
Matt Blackman is a full-time technical and financial writer and trader. He produces corporate and financial newsletters, and assists clients in getting published in the mainstream media. He is the host of TradeSystemGuru.com. Matt has earned the Chartered Market Technician (CMT) designation. Find out what stocks and futures Matt is watching on Twitter at www.twitter.com/RatioTrade
PRINT THIS ARTICLE
HEAD & SHOULDERS
Is Google On The Firing Line?
04/20/11 01:58:36 PMby Matt Blackman
Not long after its launch in 2004, Google became a market leader. That trend remained intact through good times and bad. In 2010, it flashed a bearish head & shoulders top pattern that failed to hit the target, but it was a good trade nonetheless. It's just flashed another H&S sell signal, and this one looks more promising.
Position: N/A
| Google (GOOG) could be called the stock trader's darling. Not long after its launch, momentum master trader Dan Zanger generated an eight-digit paycheck in 2005 on GOOG, not including his other trades. Whether it's soaring or falling off a cliff, the stock rarely fails to captivate traders, no matter the size of their portfolios. But here are two patterns that don't happen very often on the same stock in an 18-month period. |

|
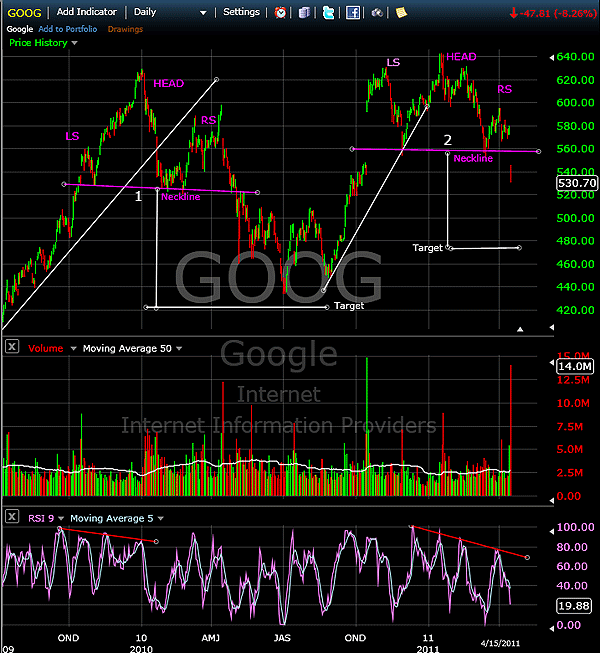
| FIGURE 1: GOOG, DAILY. Google from mid-2009 through April 15, 2011, showing fraternal twin head & shoulder top patterns, H&S1 and H&S2. |
| Graphic provided by: http://www.freestockcharts.com. |
| |
| As we see in Figure 1, GOOG flashed a bearish head & shoulders top pattern in 2009-10. Note that the left shoulder was small compared to the head and the right shoulder, indicating much more optimism as the pattern wound toward completion. It is also interesting to note that although H&S1 failed to hit its minimum projected target, the pattern was still followed by a big drop in price. Next, we examine head & shoulder pattern 2 and note some big differences. First, the height of each shoulder was almost the reverse of H&S1, showing lots of optimism early with a lack of it as the pattern progressed. The head barely rose above the height of the left shoulder and the right shoulder was downright anemic. |
| But perhaps even more interesting is the fact that H&S2 started on a major gap up and finished on Friday, April 15, with a big gap down on massive volume. H&S2 was head & shoulders and an island reversal pattern combined. According to Thomas Bulkowski, author of the "Encyclopedia Of Chart Patterns" 2nd ed., the head & shoulders top pattern is the most reliable of 21 patterns he identified, with a downtrend occurring 63% of the time the neckline was broken and the pattern confirmed. |
| As H&S2 shows, the minimum projected target, arrived at by measuring the distance from the head to the neckline then dropping the same distance below the neckline, is $475. Traders playing this pattern will be looking for GOOG to rally back toward the neckline and subsequent failure followed by a big drop toward its target price. A decisive break above the neckline on strong up volume would invalidate the pattern. As is true of many chart patterns, a failure is a good signal that it's time to quickly switch horses. It is also noteworthy that Google has been a long-term market leader, so a breakdown from here has negative implications for overall market direction. Follow Matt Blackman on Twitter at: http://www.twitter.com/Matt__Blackman |
| Suggested Reading: Bulkowski, Thomas [2005]. "Encyclopedia Of Chart Patterns," 2d ed., http://ca.wiley.com/WileyCDA/WileyTitle/productCd-0471668265.html _____. Understanding Chart Patterns, http://www.chartpattern.com/understanding_chart_patterns.html |
Matt Blackman is a full-time technical and financial writer and trader. He produces corporate and financial newsletters, and assists clients in getting published in the mainstream media. He is the host of TradeSystemGuru.com. Matt has earned the Chartered Market Technician (CMT) designation. Find out what stocks and futures Matt is watching on Twitter at www.twitter.com/RatioTrade
| Company: | TradeSystemGuru.com |
| Address: | Box 2589 |
| Garibaldi Highlands, BC Canada | |
| Phone # for sales: | 604-898-9069 |
| Fax: | 604-898-9069 |
| Website: | www.tradesystemguru.com |
| E-mail address: | indextradermb@gmail.com |
Traders' Resource Links | |
| TradeSystemGuru.com has not added any product or service information to TRADERS' RESOURCE. | |
Click here for more information about our publications!
PRINT THIS ARTICLE

|

Request Information From Our Sponsors
- VectorVest, Inc.
- Executive Premier Workshop
- One-Day Options Course
- OptionsPro
- Retirement Income Workshop
- Sure-Fire Trading Systems (VectorVest, Inc.)
- Trading as a Business Workshop
- VectorVest 7 EOD
- VectorVest 7 RealTime/IntraDay
- VectorVest AutoTester
- VectorVest Educational Services
- VectorVest OnLine
- VectorVest Options Analyzer
- VectorVest ProGraphics v6.0
- VectorVest ProTrader 7
- VectorVest RealTime Derby Tool
- VectorVest Simulator
- VectorVest Variator
- VectorVest Watchdog
- StockCharts.com, Inc.
- Candle Patterns
- Candlestick Charting Explained
- Intermarket Technical Analysis
- John Murphy on Chart Analysis
- John Murphy's Chart Pattern Recognition
- John Murphy's Market Message
- MurphyExplainsMarketAnalysis-Intermarket Analysis
- MurphyExplainsMarketAnalysis-Visual Analysis
- StockCharts.com
- Technical Analysis of the Financial Markets
- The Visual Investor
