HOT TOPICS LIST
- MACD
- Fibonacci
- RSI
- Gann
- ADXR
- Stochastics
- Volume
- Triangles
- Futures
- Cycles
- Volatility
- ZIGZAG
- MESA
- Retracement
- Aroon
INDICATORS LIST
LIST OF TOPICS
PRINT THIS ARTICLE
by Chaitali Mohile
MKS Instruments looks reluctant in bullish territory.
Position: Sell
Chaitali Mohile
Active trader in the Indian stock markets since 2003 and a full-time writer. Trading is largely based upon technical analysis.
PRINT THIS ARTICLE
WEDGE FORMATIONS
MKSI Entering New Downtrend
04/18/11 11:49:43 AMby Chaitali Mohile
MKS Instruments looks reluctant in bullish territory.
Position: Sell
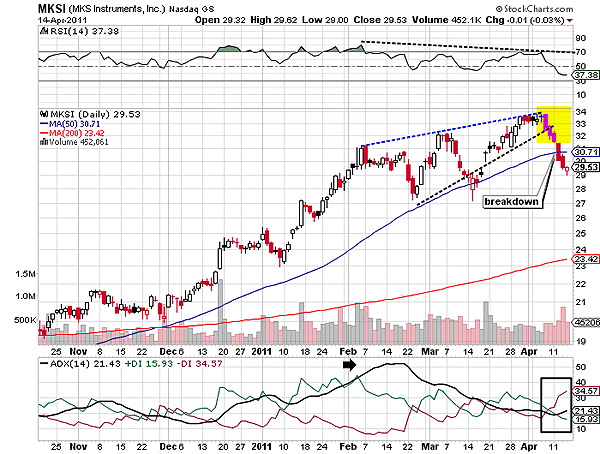
| A rising wedge, which is a bearish reversal pattern, was formed by MKS Instrument on the daily chart (Figure 1). As the name suggests, the wedge initiates a fresh bearish rally after a downward breakout. The volume, though, has not diminished; it has remained highly volatile. During the formation, the relative strength index (RSI) (14) formed lower highs, indicating a negative divergence. An overheated average directional index (ADX) (14) suggested a trend reversal possibility. Thus, the rising wedge is confirmed as the bearish reversal formation. We can see in Figure 1 that the pattern has already broken downwards, and the uptrend has plunged to the 20 levels. The breakout was pretty robust as the bears rushed with the short-positions. The large red candles that formed during the breakout reflected bearish strength in the rally. |

|
| FIGURE 1: MKSI, DAILY. The rising wedge has initiated the fresh bearish breakout rally for the stock. The three black crow candlestick formations was the cherry on the cake for the bears. |
| Graphic provided by: StockCharts.com. |
| |
| MKSI formed three consecutive red candles, each opening below the previous close and closing at the new intraday low. Thus, a three black crow pattern, another bearish trend reversal formation, appeared in Figure 1. As such, the bearish breakout of the rising wedge began the bearish rally. But the formation of the bearish candlestick formation boosted the downtrend to develop faster. Eventually, MKSI breached the 50-day moving average support. The RSI (14) has slipped below the 50 levels, indicating a lack of bullish strength. Under such a situation, the downtrend would grow stronger with declining price levels. |

|
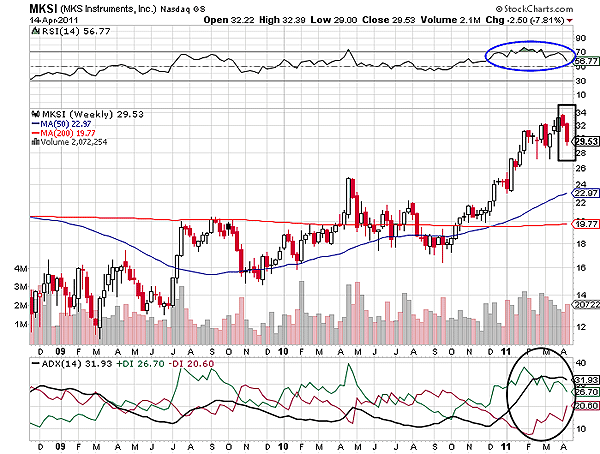
| FIGURE 2: MKSI, WEEKLY. The third bearish candle (if formed) would confirm the three black crow formation on the weekly time frame as well. |
| Graphic provided by: StockCharts.com. |
| |
| The vertical rally on the weekly time frame in Figure 2 has changed its direction (see the black box). MKSI has already formed two red (bearish) candles; therefore, the stock may once again form the three black crow candlestick patterns. The pattern would get confirmed only if the third candle is also bearish. The RSI (14) is hesitant to cross the overbought levels at 70, and the ADX (14) is declining from the developing uptrend region. The picture looks reversing in favor of bears. Hence, there is a possibility of the third red candle being constructed in Figure 2. This would enhance the bearish power over the medium-term downtrend. |
| To conclude, MKSI is ready to enter an intermediate downtrend. |
Active trader in the Indian stock markets since 2003 and a full-time writer. Trading is largely based upon technical analysis.
| Company: | Independent |
| Address: | C1/3 Parth Indraprasth Towers. Vastrapur |
| Ahmedabad, Guj 380015 | |
| E-mail address: | chaitalimohile@yahoo.co.in |
Traders' Resource Links | |
| Independent has not added any product or service information to TRADERS' RESOURCE. | |
Click here for more information about our publications!
PRINT THIS ARTICLE

Request Information From Our Sponsors
- VectorVest, Inc.
- Executive Premier Workshop
- One-Day Options Course
- OptionsPro
- Retirement Income Workshop
- Sure-Fire Trading Systems (VectorVest, Inc.)
- Trading as a Business Workshop
- VectorVest 7 EOD
- VectorVest 7 RealTime/IntraDay
- VectorVest AutoTester
- VectorVest Educational Services
- VectorVest OnLine
- VectorVest Options Analyzer
- VectorVest ProGraphics v6.0
- VectorVest ProTrader 7
- VectorVest RealTime Derby Tool
- VectorVest Simulator
- VectorVest Variator
- VectorVest Watchdog
- StockCharts.com, Inc.
- Candle Patterns
- Candlestick Charting Explained
- Intermarket Technical Analysis
- John Murphy on Chart Analysis
- John Murphy's Chart Pattern Recognition
- John Murphy's Market Message
- MurphyExplainsMarketAnalysis-Intermarket Analysis
- MurphyExplainsMarketAnalysis-Visual Analysis
- StockCharts.com
- Technical Analysis of the Financial Markets
- The Visual Investor
