HOT TOPICS LIST
- MACD
- Fibonacci
- RSI
- Gann
- ADXR
- Stochastics
- Volume
- Triangles
- Futures
- Cycles
- Volatility
- ZIGZAG
- MESA
- Retracement
- Aroon
INDICATORS LIST
LIST OF TOPICS
PRINT THIS ARTICLE
by Donald W. Pendergast, Jr.
Shares of Hudson City Bancorp are down sharply since the start of the year, but one trading system still thinks it's a good time to initiate a new short position.
Position: N/A
Donald W. Pendergast, Jr.
Donald W. Pendergast is a financial markets consultant who offers specialized services to stock brokers and high net worth individuals who seek a better bottom line for their portfolios.
PRINT THIS ARTICLE
TRADING SYSTEMS
Hudson City Bancorp New Sell Signal
04/15/11 09:04:26 AMby Donald W. Pendergast, Jr.
Shares of Hudson City Bancorp are down sharply since the start of the year, but one trading system still thinks it's a good time to initiate a new short position.
Position: N/A
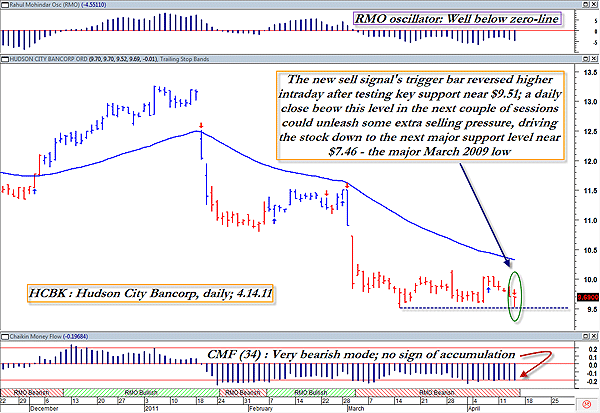
| Any time a large-cap stock drops about 30%, you can bet that it will end up on an analyst's or newsletter's value or bottom-fishing list of stocks that should be purchased. While in the case of certain stocks this can be a good buying opportunity, you still need to take a glance at the larger economic and/or stock market backdrop before rushing blindly into any kind of value play. Remember how violently stocks were falling from late 2007 through early 2009? Not many financial sector stocks were a good buy after their first 30% tumble from their early 2007 highs, and those who stayed with such ill-timed purchases might have ultimately lost 50 to 90% of their invested funds in such stocks, especially if they sold out near the bottom of the financial panic phase going into early 2009. The big idea here is this -- know which way the financial landscape winds are blowing before arbitrarily deciding that a 10%, 20%, or even 30% correction in the price of a quality stock is a true buying opportunity. Here's a look at the stock of a fairly big player in the Northeast US banking industry, Hudson City Bancorp (HCBK) (Figure 1). |

|
| FIGURE 1: HCBK, DAILY. The concept of support and resistance (S/R) is perhaps the single most vital price dynamic you will see at work on any stock or commodity price chart. Strong buy or sell signals from well-developed trading systems that occur near these critical S/R zones can help identify powerful trading opportunities. |
| Graphic provided by: MetaStock. |
| Graphic provided by: Rahul Mohindar RMO from MetaStock 11. |
| |
| Currently, we see a brand-new RMO (Rahul Mohindar) swing sell signal on HCBK's daily chart, and along with it, a weak RMO oscillator histogram (top of chart) and also a very weak medium-term money flow configuration, as depicted by the 34-period Chaikin money flow histogram at the bottom of the chart. So there's no big revelation here; HCBK is in a confirmed downtrend (lower swing highs and lower swing lows), has weak money flow, and bearish downward momentum. And the RMO swing trading system says it's a good time to take a walk on the short side of this stock. One interesting aspect of this trade setup is that the signal arrived just after the stock tested key support at $9.51 and then managed a minor intraday reversal to close at $9.69. Traders need to keep a close watch on that support line (blue dashed line), because if you get a daily close below it, the next major support level in this stock is at $7.46, which also happens to be the major March 2009 low not only for HCBK but for the entire broad market. |
| Running a two- to three-bar trailing stop of the daily lows might be the simplest and most objective way to follow this short position, after an entry a few ticks below the $9.51 support level previously discussed. It usually pays to run a close stop and/or set a modest profit target on a short stock trade, mostly because of how quickly and violently a short squeeze can materialize in any given market. Spend some more research time on this setup yourself and see if you also agree with the basic trade setup assessment presented in this article. |
Donald W. Pendergast is a financial markets consultant who offers specialized services to stock brokers and high net worth individuals who seek a better bottom line for their portfolios.
| Title: | Writer, market consultant |
| Company: | Linear Trading Systems LLC |
| Jacksonville, FL 32217 | |
| Phone # for sales: | 904-239-9564 |
| E-mail address: | lineartradingsys@gmail.com |
Traders' Resource Links | |
| Linear Trading Systems LLC has not added any product or service information to TRADERS' RESOURCE. | |
Click here for more information about our publications!
PRINT THIS ARTICLE

Request Information From Our Sponsors
- VectorVest, Inc.
- Executive Premier Workshop
- One-Day Options Course
- OptionsPro
- Retirement Income Workshop
- Sure-Fire Trading Systems (VectorVest, Inc.)
- Trading as a Business Workshop
- VectorVest 7 EOD
- VectorVest 7 RealTime/IntraDay
- VectorVest AutoTester
- VectorVest Educational Services
- VectorVest OnLine
- VectorVest Options Analyzer
- VectorVest ProGraphics v6.0
- VectorVest ProTrader 7
- VectorVest RealTime Derby Tool
- VectorVest Simulator
- VectorVest Variator
- VectorVest Watchdog
- StockCharts.com, Inc.
- Candle Patterns
- Candlestick Charting Explained
- Intermarket Technical Analysis
- John Murphy on Chart Analysis
- John Murphy's Chart Pattern Recognition
- John Murphy's Market Message
- MurphyExplainsMarketAnalysis-Intermarket Analysis
- MurphyExplainsMarketAnalysis-Visual Analysis
- StockCharts.com
- Technical Analysis of the Financial Markets
- The Visual Investor
